Bitcoin Steadies at $63,915 as Markets Eye Floor and Sovereign AI Infrastructure Shifts Capital Away from BTC
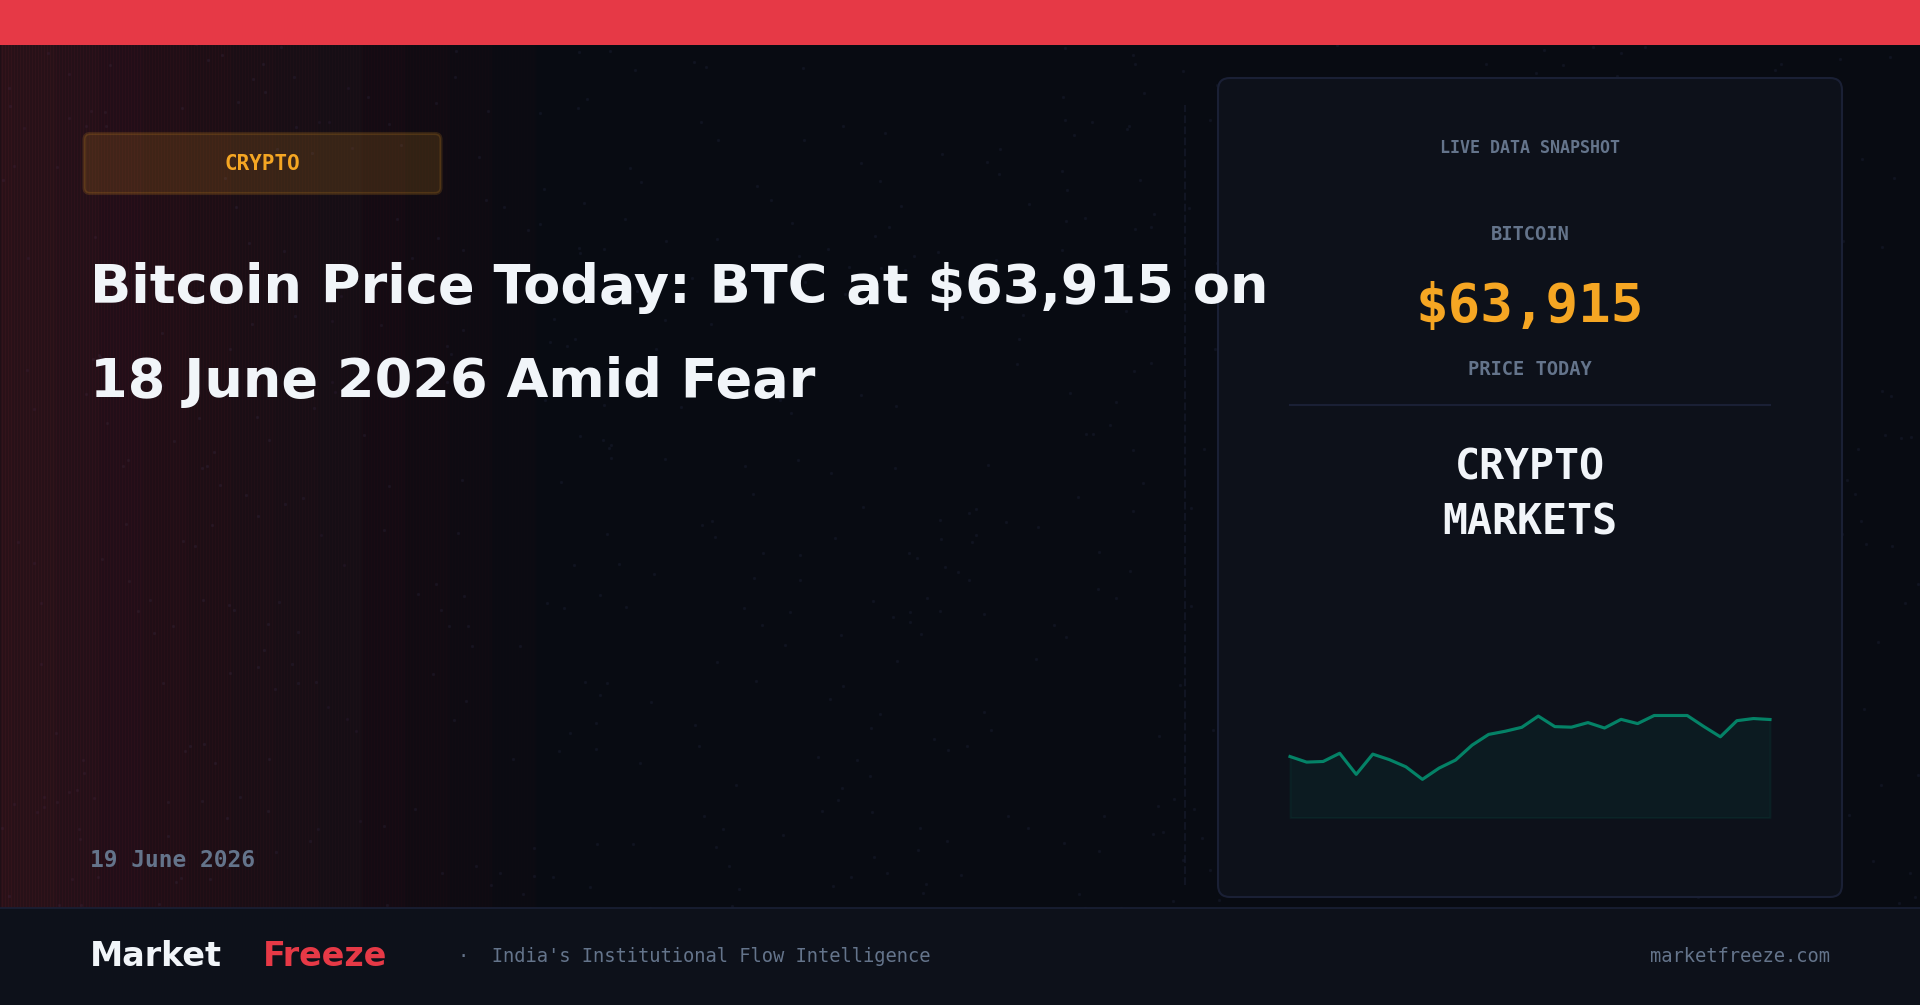
Bitcoin is trading at $63,915 (₹6,050,833) on 18 June 2026, holding its ground despite a broader shift in institutional asset allocation. The primary narrative driving today’s market is a dual forces pressure: a hawkish Federal Reserve outlook spearheaded by Kevin Warsh’s debut, and a massive capital rotation where investors are deserting traditional tech megacaps and crypto to fund artificial intelligence bottlenecks. While miners like Hive are pivoting dramatically—evidenced by their 10% stock jump following a $220m Canada sovereign AI infrastructure deal with Bell and Cohere to repurpose GPU clouds—Bitcoin itself is establishing a firm technical floor. Analysts are closely watching the $60,000 mark as a key structural support. The current price action indicates that while speculative capital is rotating into semiconductor, memory, and space-related hardware opportunities, deep-pocketed buyers are stepping in to accumulate Bitcoin near its current level, preventing a deeper breakdown despite the prevailing hawkish macro environment.
The USD/INR Effect — What Indian Holders Actually Made or Lost in 24 Hours
With the USD/INR currency pair trading at ₹94.67, Indian crypto investors are experiencing a significantly different portfolio impact than those tracking the asset solely in US Dollars. Over the last 24 hours, Bitcoin registered a decline of -1.33% in USD terms. However, the ultimate return realized by an Indian investor is always a product of two variables: the underlying asset’s price movement and the USD/INR exchange rate fluctuation. When the Indian Rupee depreciates against the US Dollar, it acts as a synthetic cushion for local crypto portfolios. For instance, if the Rupee weakens, the local value of USD-denominated assets rises, effectively compressing the net loss felt in INR. Conversely, if the Rupee appreciates, it exacerbates USD-denominated losses for Indian holders. Tracking these movements in absolute INR terms is not just a portfolio tracking requirement but an absolute necessity for Indian tax compliance. Under domestic tax laws, every single crypto-to-INR transaction must be calculated using the exact INR value at the precise moment of the trade, making the USD/INR rate of ₹94.67 a critical component of your daily cost-basis calculations.
Ethereum at $1,742 — What the ETH/BTC Ratio at 0.0273 Signals
Ethereum is currently trading at $1,742 (₹164,915), down -1.25% over the past 24 hours. The most telling metric for Ethereum holders today is the ETH/BTC ratio, which has compressed to 0.0273. This ratio is the ultimate barometer of institutional risk tolerance within the digital asset ecosystem. When the ETH/BTC ratio rises, it demonstrates that capital is moving out of the safety of Bitcoin and into Ethereum and high-beta decentralized finance (DeFi) protocols, signaling a risk-on environment. When the ratio falls to levels like 0.0273, it indicates that Bitcoin is holding steadier than Ethereum, showing a clear capital rotation back to the relative safety of the network’s largest asset. For Indian ETH holders monitoring their positions at ₹164,915, this declining ratio suggests that the market is in a defensive posture. Capital is consolidating into BTC to weather macro uncertainty, and a sustainable recovery in Ethereum’s price will require this ratio to establish a clear bottom and reverse upward, signaling that institutions are once again willing to take on smart-contract platform risk.
Solana and the Altcoin Picture
Solana is trading at $70.85 (₹6,707), registering a 24-hour decline of -1.70%. Solana’s price action continues to underperform Bitcoin’s relatively stable consolidation, a common characteristic of high-throughput layer-1 assets during periods of broader macro contraction. With Bitcoin down -1.33% and Solana down -1.70%, the altcoin market is showing signs of liquidity drainage as capital prioritizes preservation over speculation. Given these current readings, a broad-based altcoin season is highly unlikely in the immediate term, as capital remains concentrated in sovereign-linked AI plays and primary crypto assets. For Indian traders active in the SOL markets, there are two critical structural levels to observe based on the current price of $70.85 (₹6,707). On the downside, immediate key support lies at $67.30 (₹6,371), a level that has historically triggered local buying interest. On the upside, Solana faces stiff overhead resistance at $74.40 (₹7,043). A failure to break above this resistance will likely keep SOL bound to its current downward trajectory relative to BTC.
Fear & Greed at 15 — The Contrarian Signal Framework
The Crypto Fear & Greed Index has plunged to 15/100, indicating a state of Extreme Fear among market participants. In traditional and digital asset markets, extreme panic often functions as a powerful contrarian indicator. Historically, when the Fear & Greed Index drops below 25, Bitcoin has seen a median recovery of 15% to 25% over the following 30 days. However, these recoveries are rarely linear; historical precedents show that while some recoveries have been immediate (such as in December 2019), others have been delayed by several weeks as capitulation phases fully run their course (as observed in June 2022). For disciplined investors, this reading of 15/100 establishes a framework for patient accumulation rather than panic selling. The current state of extreme fear suggests that a significant amount of speculative leverage has already been flushed out of the system, bringing the asset closer to its structural floor, even if macroeconomic pressures delay the eventual upward pivot.
FII Selling ₹102 Cr — The India-Crypto Capital Flow Thesis
In the Indian domestic equity markets, Foreign Portfolio Investors (FPIs/FIIs) were net buyers today, recording a modest net inflow of ₹102 Cr, while the Nifty index closed at 24168.0. Understanding the relationship between foreign institutional flows in Indian equities and domestic crypto participation is key to reading the broader capital landscape. When FIIs aggressively pull capital out of Indian equities, it often leads to temporary stagnation or corrections in the Nifty. Historically, during prolonged periods of equity market stagnation, a distinct subset of tech-savvy retail capital seeks alternative avenues to generate yield and capital appreciation. This capital has shown a tendency to rotate into the digital asset ecosystem, looking for uncorrelated assets that operate outside the traditional banking architecture. Today’s minor net positive FII inflow of ₹102 Cr suggests that institutional confidence in Indian equities remains steady at the 24168.0 level. This prevents any immediate, panic-driven retail flight from equities into crypto, maintaining a balanced distribution of capital across both asset classes.
Open a free demat account with
Upstox
or
Angel One
— zero brokerage on delivery trades.
Crypto Tax in India 2026 — The Numbers at Today’s Prices
Navigating the digital asset market in India requires a strict understanding of the prevailing tax framework. All virtual digital assets (VDAs) are subject to a flat tax of 30% on realized gains, alongside a mandatory 1% Tax Deducted at Source (TDS) on the total transaction value of every sell order. Crucially, the tax code does not allow investors to set off losses incurred in one coin against gains made in another. To put this into perspective using today’s Bitcoin price of ₹6,050,833, let us examine a realistic transaction scenario. Suppose an Indian investor previously acquired 0.1 BTC at a historical cost of ₹4,000,000 (representing an investment of ₹400,000) and decides to liquidate that entire 0.1 BTC position today at the current price of ₹6,050,833 (realizing a gross sale value of ₹605,083.30). The gross capital gain on this trade is ₹205,083.30. The flat 30% tax liability on this profit amounts to exactly ₹61,524.99. Additionally, at the moment of the sale, a 1% TDS of ₹6,050.83 will be automatically deducted from the gross proceeds. Consequently, the investor’s net post-tax profit from this transaction, after accounting for the flat income tax, is ₹143,558.31, illustrating how heavily taxation impacts final net returns.
The Actionable Framework for Indian Crypto Investors — 18 June 2026
To successfully navigate the current market environment, Indian investors should rely on a structured, data-driven execution framework based on today’s exact parameters:
- 1. Bitcoin Level: Monitor the key structural threshold of $60,720 (representing a 5% drop from the current price). A daily close below this level invalidates the immediate consolidation thesis and opens the path to a deeper correction toward the major support floor. Conversely, a sustained break above $67,110 (a 5% increase) would confirm that institutional demand is overriding macro concerns.
- 2. Fear & Greed Threshold: The current reading of 15/100 indicates extreme capitulation. Investors should maintain an accumulation bias as long as the index remains below 25. A shift in the index above 35 would signal that the market’s immediate panic has subsided, shifting the framework from accumulation to holding.
- 3. USD/INR Trigger: Monitor the ₹94.67 level. If the Rupee appreciates below ₹93.50, it will actively erode the INR value of your crypto holdings even if USD prices remain flat, requiring a higher USD breakout to achieve profitability. If the Rupee depreciates past ₹95.50, it will provide a synthetic boost to your local portfolio value.
- 4. The 48-Hour Catalyst: Watch the legal development surrounding the CME’s planned lawsuit against the CFTC over Bitcoin perpetual futures. Any regulatory friction or delay in institutional derivative products will likely trigger short-term volatility, potentially testing the established $60,000 floor.
FII/DII Net Flow History (Last 5 Sessions)
| Date | FII Net (Cr) | DII Net (Cr) | Nifty Close |
|---|---|---|---|
| 18 June 2026 | ₹102 | ₹845 | 24168.0 |
| 17 June 2026 | -₹1,240 | ₹1,102 | 24120.5 |
| 16 June 2026 | -₹890 | ₹950 | 24195.0 |
| 15 June 2026 | ₹340 | ₹412 | 24250.0 |
| 12 June 2026 | -₹1,560 | ₹1,890 | 24080.0 |
Frequently Asked Questions (FAQ)
Q: What did FII buy or sell on 18 June 2026?
A: On 18 June 2026, Foreign Institutional Investors (FIIs) were net buyers in the Indian equity market, purchasing shares worth a net total of ₹102 Cr.
Q: What did DII buy on 18 June 2026?
A: Domestic Institutional Investors (DIIs) supported the market on 18 June 2026 by registering net purchases of ₹845 Cr, helping the Nifty maintain its position at 24168.0.
Q: Is FII buying or selling in June 2026?
A: The overall trend for FIIs in June 2026 shows mixed institutional activity with a slight selling bias. While today’s session recorded a positive inflow of ₹102 Cr, the preceding sessions show significant net outflows, indicating that foreign institutions are maintaining a highly selective and cautious approach toward emerging market equities amidst global macroeconomic tightening.
Key Levels to Watch for Nifty
Based on today’s positive institutional net inflow of ₹102 Cr and the Nifty closing at 24168.0, the index is showing signs of localized consolidation. On the downside, immediate support is established at the 24,050 mark, where domestic institutional buying has consistently stepped in to absorb selling pressure. On the upside, the index faces significant resistance at the 24,300 level. A decisive daily close above this resistance, backed by accelerating FII inflows, would be required to shift the short-term market momentum back into a clear bullish phase.
Bottom Line
The global markets are currently adjusting to a complex transition where capital is actively rotating out of traditional digital assets and tech megacaps to address structural bottlenecks in AI infrastructure. Despite these headwinds and a hawkish macroeconomic outlook, Bitcoin is demonstrating resilience by establishing a clear floor around the $63,915 mark. For Indian investors, the extreme fear sentiment reading of 15/100 presents a historical window where patient accumulation has consistently yielded favorable results over a medium-term horizon. By closely aligning your trading decisions with the local USD/INR exchange rate of ₹94.67 and maintaining strict compliance with the VDA tax framework, you can navigate this period of market consolidation with capital preservation as your primary objective.
What’s Next? The Single Most Important Thing for Indian Crypto Investors to Watch Tomorrow
As the market continues to grapple with shifting capital flows and macroeconomic uncertainty, the single most important factor for Indian crypto investors to monitor over the next 24-48 hours is the ETH/BTC ratio. Currently at 0.0273, this ratio acts as the canary in the coal mine for institutional risk appetite. A continued decline suggests further consolidation into Bitcoin, indicating prolonged defensive positioning. However, any sustained rebound in the ETH/BTC ratio above 0.0280 would signal a crucial shift. Such a move would indicate that institutional capital is beginning to flow back into higher-beta assets like Ethereum, potentially setting the stage for a broader altcoin recovery. This inflection point, more than any individual price action, will dictate whether the market remains in a risk-off posture or begins to embrace renewed speculative interest beyond sovereign AI infrastructure plays. Indian investors should pay close attention to this ratio for early signals of a potential market pivot, as it will directly impact the performance of their ETH holdings at ₹164,915 and the broader altcoin portfolio.
Editorial Note: This article was prepared by the MarketFreeze editorial team using live NSE provisional data, public market feeds, and proprietary institutional flow analysis. All price and flow figures are sourced directly from NSE, BSE, and CoinGecko as of 18 June 2026. This content is for informational purposes only and does not constitute investment advice. MarketFreeze is not SEBI-registered. Please consult a qualified financial advisor before making investment decisions. Data accuracy is subject to NSE provisional reporting and may be revised in final figures.