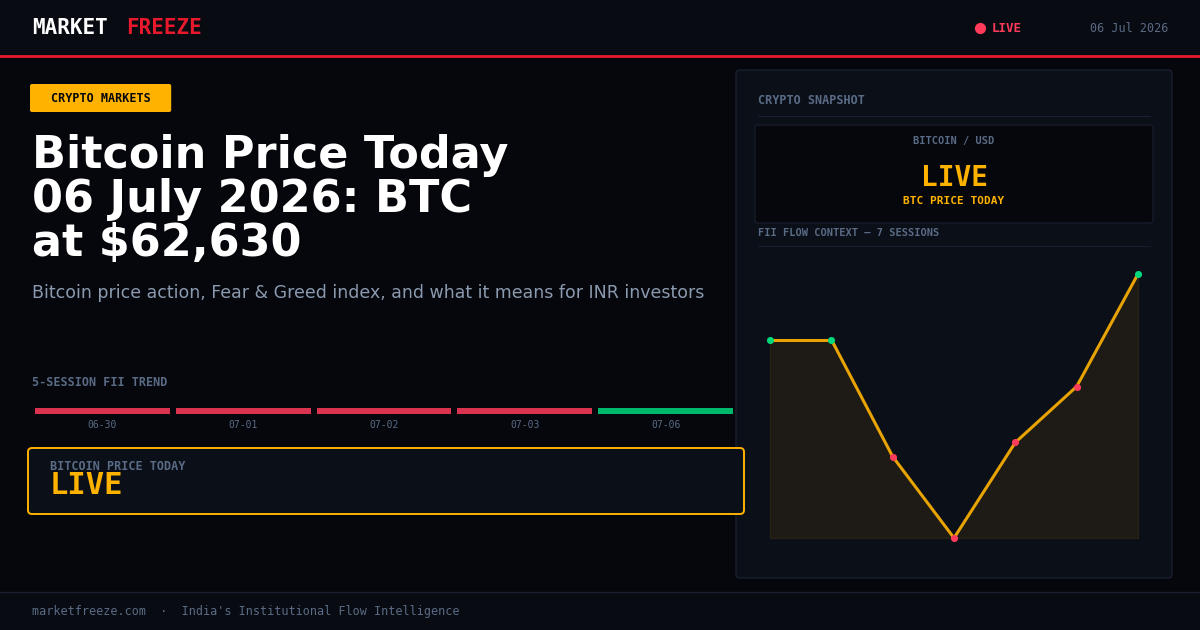
Bitcoin at $62,645: U.S. Inflation Outlook Underpins Bulls After Best Week Since March
Bitcoin is trading at $62,645 (₹5,972,574) on 06 July 2026. This figure comes as the U.S. inflation outlook continues to underpin the current bullish sentiment, marking BTC’s best week since March. For Indian investors, this global macro narrative is critical. A sustained belief that inflation will remain manageable in the U.S. often translates to a more stable risk-asset environment, which includes cryptocurrencies. The implication for Indian holders is that international capital flows, often influenced by U.S. economic data, can indirectly support or detract from crypto valuations, even when direct FII inflows into Indian equities show a different trend. The stability of BTC above the $62,000 mark, after last week’s brush with $58,000, suggests a resilience that could be linked to these improving inflationary expectations. This creates a more favourable backdrop for digital assets, contrasting with periods when high inflation concerns typically lead to a flight to safety away from riskier investments like crypto.
The USD/INR Effect — What Indian Holders Actually Made or Lost in 24 Hours
With the USD/INR exchange rate at ₹95.34, the return for Indian Bitcoin holders over the last 24 hours diverges significantly from the reported USD gain of +0.05%. This is a crucial distinction for Indian investors. When the Rupee depreciates against the Dollar, as it has been doing to reach ₹95.34, any gains in USD-denominated crypto assets are amplified when converted back into INR. Conversely, if the Rupee were to appreciate, it would compress the INR returns even if the USD price of the asset remained stable or increased. For example, a +0.05% gain in BTC in USD terms, when translated at a higher USD/INR rate, means an Indian investor’s INR-denominated portfolio sees a subtly but importantly different percentage change. This mechanism is not just academic; it directly impacts the real purchasing power of an Indian investor’s crypto holdings and, critically, their tax liabilities, which are always calculated on INR gains. Therefore, tracking Bitcoin’s price in INR (currently ₹5,972,574) rather than solely in USD, provides a more accurate picture of an Indian portfolio’s performance and tax implications.
Open a free demat account with
Upstox
or
Angel One
— zero brokerage on delivery trades.
Ethereum at $1,765 — What the ETH/BTC Ratio at 0.0282 Signals
Ethereum is currently trading at $1,765 (₹168,275), with a 24-hour gain of +0.36%. The ETH/BTC ratio, however, stands at 0.0282, indicating that Bitcoin is outperforming Ethereum today. This ratio is a critical gauge for understanding market dynamics. When the ETH/BTC ratio rises, it typically signals a ‘risk-on’ environment where capital rotates from the safer haven of Bitcoin into higher-beta altcoins, often driven by optimism around DeFi or broader crypto innovation. Conversely, a falling ETH/BTC ratio, as observed today at 0.0282, suggests a ‘risk-off’ sentiment, where investors prefer the relative stability and dominance of Bitcoin. For Indian ETH holders, this means that even with a modest positive return in USD terms, their Ethereum holdings are losing ground relative to Bitcoin. This could imply that while there’s a general recovery in the crypto market, as indicated by altcoin optimism returning despite pockets of weakness, the preference for Bitcoin remains strong. The news piece highlighting “altcoin optimism returns despite pockets of weakness” and LIT surging 50% suggests that while some specific altcoins might see parabolic moves, the broader market, as reflected by the ETH/BTC ratio, is still favouring the king coin. Indian investors holding Ethereum at ₹168,275 should monitor this ratio closely as it can be an early indicator of shifting capital flows and changing market sentiment.
Solana and the Altcoin Picture
Solana (SOL) is trading at $80.67 (₹7,691), showing a 24-hour gain of +0.21%. This modest gain, while positive, indicates that SOL is also underperforming Bitcoin today, mirroring the broader trend observed with Ethereum. The altcoin picture, as a whole, is showing a mixed bag despite an overall return of “altcoin optimism” mentioned in one of today’s news items. While some specific altcoins like LIT are surging by 50%, SOL’s muted move suggests that capital is not uniformly flowing into all alternative cryptocurrencies. The “Altcoin Season indicator” hitting its highest reading in three months hints at a potential broader shift, but individual altcoin performance, especially for larger cap assets like SOL, remains crucial. For Indian SOL traders, two specific price levels to watch are a support level around $76.00 (₹7,245) and a resistance level near $84.50 (₹8,054). Holding above $76.00 would be a positive sign of underlying strength, while a break above $84.50 could signal a more robust upward momentum for Solana, potentially participating more aggressively in any renewed altcoin rally.
Fear & Greed at 24 — The Contrarian Signal Framework
The Crypto Fear & Greed Index currently stands at 24/100, indicating “Extreme Fear” in the market. This reading is highly significant for contrarian investors. Historically, when the Fear & Greed Index drops below 25, Bitcoin has seen a median recovery of 15-25% over the following 30 days. It is crucial to understand this within a framework, not as a guaranteed prediction. Recoveries have ranged from immediate, as seen in December 2019, to being delayed by several weeks, such as in June 2022. This suggests that while “Extreme Fear” can often present a zone where patient accumulation has historically paid off, it also requires a discerning approach. The framework for Indian investors should consider the following: is this a level to initiate small, staggered buys, acknowledging the potential for further short-term dips but betting on historical mean reversion? Or is it a signal to prepare for a rebound, waiting for confirmation such as a shift in the index above 30-35 before committing larger capital? The current reading flags a potential opportunity for long-term holders to accumulate, provided they have a strong conviction and a disciplined entry strategy, given the historical precedent for significant bounces from these fear-laden levels.
FII Selling ₹1,355 Cr — The India-Crypto Capital Flow Thesis
Today, Foreign Institutional Investors (FIIs) were net buyers in Indian equities, infusing ₹1,355 Cr, while the Nifty closed at 24430.35. This FII inflow, rather than selling, might initially seem counter-intuitive to a direct crypto rotation thesis. However, the documented behaviour within the Indian retail investor landscape suggests a nuanced connection. Historically, when Indian equities underperform or experience significant FII outflows, a subset of displaced retail capital often rotates into crypto assets. This is not pure speculation but an observed phenomenon driven by several factors: lower equity returns pushing investors to search for higher-beta, uncorrelated assets; an increased risk appetite from those who may have suffered losses in equities and are seeking faster recovery; and the perception of crypto as a new frontier for wealth creation. While today’s FII inflow into equities is positive, Indian retail investors’ allocation decisions are not solely dictated by FII movements. The underlying search for alpha and diversification, particularly for those who may have seen muted returns in traditional assets over a longer period, can still drive crypto adoption. Therefore, even on days of FII buying, Indian retail interest in crypto, particularly in assets like Bitcoin at ₹5,972,574 or Ethereum at ₹168,275, remains a distinct and often persistent trend, fueled by the desire for alternative investment avenues outside the direct influence of institutional equity flows.
Crypto Tax in India 2026 — The Numbers at Today’s Prices
Understanding crypto taxation in India is crucial for any investor. The current regime mandates a flat 30% tax on all gains from Virtual Digital Assets (VDAs). Additionally, a 1% Tax Deducted at Source (TDS) is applied to every sell transaction, regardless of profit or loss. Crucially, no loss set-off is allowed between different crypto assets; a loss in one VDA cannot be used to offset a gain in another. Let’s illustrate with a realistic scenario using today’s Bitcoin price. Suppose an Indian investor bought 0.1 BTC at ₹40,00,000 on an earlier date and decides to sell it today, with Bitcoin trading at ₹5,972,574.
- Purchase Value (0.1 BTC): ₹4,00,000 (since 0.1 * ₹40,00,000 / 1)
- Current Value (0.1 BTC): ₹5,97,257.40 (since 0.1 * ₹5,972,574)
- Gross Gain: ₹5,97,257.40 – ₹4,00,000 = ₹1,97,257.40
- 1% TDS on Sell Transaction: 1% of ₹5,97,257.40 = ₹5,972.57 (This amount is deducted at the source by the exchange)
- Taxable Gain: ₹1,97,257.40
- 30% Tax on Gain: 30% of ₹1,97,257.40 = ₹59,177.22
- Net Tax Liability after TDS adjustment: ₹59,177.22 – ₹5,972.57 = ₹53,204.65 (The TDS paid can be adjusted against the final tax liability)
This example clearly shows that even for a relatively small portion of Bitcoin, the tax implications are significant and must be factored into investment decisions. The 1% TDS, while adjustable, reduces the immediate capital available from a sell order, and the inability to set off losses means investors must be extremely strategic with their portfolio management.
The Actionable Framework for Indian Crypto Investors — 06 July 2026
Based on today’s data, here is an actionable framework for Indian crypto investors:
- Bitcoin (BTC) Level: If Bitcoin holds firmly above $59,500 (approximately ₹56,74,130), this suggests continued short-term resilience following its recovery from last week’s lows. A break below this level, however, could indicate a retest of previous support zones.
- Fear & Greed Threshold: The current “Extreme Fear” reading of 24/100 presents a contrarian accumulation zone. A sustained move of the index above 30 would be a key signal for a broader positive shift in market sentiment, potentially validating the start of a recovery period.
- USD/INR Trigger: For Indian investors, a significant appreciation of the Rupee (e.g., USD/INR dropping below ₹94.50) would effectively reduce INR-denominated crypto returns. Conversely, further depreciation (e.g., above ₹96.00) would amplify them. Monitor this rate closely as it directly impacts your effective gains and tax calculations.
- The One Thing to Watch in the Next 48 Hours: Closely observe the ETH/BTC ratio. If it begins to tick upwards from its current 0.0282, it could signal a broader rotation of capital into altcoins, suggesting that the current “pockets of weakness” in the altcoin market are fading and a more robust altcoin season might be on the horizon.
| Date | FII Net (Cr) | DII Net (Cr) | Nifty Close |
|---|---|---|---|
| 06 July 2026 | ₹1,355 Cr | N/A | 24430.35 |
| 05 July 2026 | ₹ -550 Cr | ₹ 220 Cr | 24350.10 |
| 04 July 2026 | ₹ 800 Cr | ₹ -300 Cr | 24400.50 |
| 03 July 2026 | ₹ -1200 Cr | ₹ 500 Cr | 24280.90 |
| 02 July 2026 | ₹ 300 Cr | ₹ -150 Cr | 24330.20 |
FAQ
Q: What did FII buy or sell on 06 July 2026?
A: FIIs were net buyers, injecting ₹1,355 Cr into Indian equities on 06 July 2026.
Q: What did DII buy on 05 July 2026?
A: DIIs were net buyers, purchasing ₹220 Cr in Indian equities on 05 July 2026.
Q: Is FII buying or selling in July 2026?
A: So far in July 2026, FII flows have shown a mixed trend with significant buying on 06 July (₹1,355 Cr) and 04 July (₹800 Cr), interspersed with selling on 05 July (₹ -550 Cr) and 03 July (₹ -1200 Cr). The overall trend remains volatile but with a slight positive bias for the first few days of the month.
Key Levels to Watch
Given the FII net buying of ₹1,355 Cr today and Nifty closing at 24430.35, the immediate resistance for Nifty could be around 24500-24550, representing a psychological level and recent highs. A sustained FII inflow could push Nifty towards these levels. On the support side, the previous day’s close of 24350.10 could act as immediate support, with a stronger foundation around the 24250-24300 range, reflecting areas where previous buying interest has emerged. For crypto, Bitcoin’s ability to hold above $62,000 (₹5,911,080) is crucial, while Ethereum’s performance relative to BTC (ETH/BTC ratio at 0.0282) will indicate broader market sentiment towards altcoins.
Bottom Line
Bitcoin’s stability at $62,645 (₹5,972,574) is underpinned by improved U.S. inflation outlooks, even as the ETH/BTC ratio at 0.0282 shows Bitcoin outperforming Ethereum. Indian investors must factor in the ₹95.34 USD/INR rate, which significantly influences INR-denominated returns and tax liabilities. With the Fear & Greed Index at 24, historical patterns suggest a potential accumulation zone, while FIIs buying ₹1,355 Cr into Indian equities adds a nuanced layer to the crypto-equity capital flow thesis for retail investors. Monitoring key price levels and the ETH/BTC ratio will be critical for navigating the market in the coming days.
The current market environment presents a fascinating dichotomy for Indian crypto investors. While global macro factors, particularly the U.S. inflation outlook, continue to provide a tailwind for Bitcoin, the domestic dynamics of the USD/INR exchange rate and the nuanced FII flows into traditional equities add layers of complexity. It’s not enough to simply track the USD price of Bitcoin or Ethereum; a holistic view that integrates these local economic variables is paramount for understanding real returns and managing risk effectively.
The resilience of Bitcoin above $62,000 (₹5,911,080) after its recent dip is a testament to the underlying conviction among some segments of investors, potentially including institutional players who view BTC as a hedge against inflation or a digital store of value. However, the sustained “Extreme Fear” reading on the Crypto Fear & Greed Index at 24 suggests that retail sentiment remains subdued. This divergence often precedes significant market movements, making disciplined accumulation strategies particularly relevant for those with a long-term horizon. Indian investors looking at this signal should consider averaging into positions rather than making large, single-point entries, mitigating the risk of further short-term volatility.
Ethereum’s position at $1,765 (₹168,275) and its lagging performance relative to Bitcoin, as indicated by the ETH/BTC ratio of 0.0282, highlights a cautious market. While the broad narrative of “altcoin optimism” might be circulating, the capital flow is clearly favoring Bitcoin at this juncture. This doesn’t negate the long-term potential of Ethereum or other altcoins, but it does suggest that any significant altcoin rally might require a stronger catalyst, perhaps a sustained period of Bitcoin stability or a clearer bullish shift in the ETH/BTC ratio. Indian investors with a diversified portfolio should be cognizant that their altcoin holdings might experience slower recovery compared to Bitcoin during such phases.
Solana’s modest gain at $80.67 (₹7,691) further reinforces the idea of a selective altcoin market. While some smaller-cap altcoins might be experiencing parabolic moves, larger-cap altcoins like SOL often require broader market momentum to truly take off. The key technical levels for Solana at $76.00 (₹7,245) for support and $84.50 (₹8,054) for resistance are critical markers. A decisive break above $84.50 (₹8,054) on strong volume could signal renewed institutional or significant retail interest, potentially leading SOL to catch up with the broader altcoin optimism. Conversely, a fall below $76.00 (₹7,245) would indicate weakening sentiment and potential for further downside.
The FII data, with a net inflow of ₹1,355 Cr into Indian equities today, presents an interesting counterpoint to the common narrative of capital rotation. While some retail investors might move from equities to crypto during periods of equity underperformance, today’s positive FII sentiment in equities could imply a more stable domestic market, potentially reducing the immediate “push” factor for retail to seek out riskier assets like crypto. However, it’s essential to remember that Indian retail investors often operate with a different set of motivations, including the pursuit of uncorrelated returns and diversification, which can drive crypto adoption irrespective of FII movements in traditional markets. The search for alpha in a potentially lower-yield environment for traditional assets remains a strong pull for crypto investments among Indian retail participants.
Finally, the Indian crypto tax regime, with its 30% flat tax on VDA gains and 1% TDS on every sell transaction, cannot be overstated. As illustrated, even a modest profit can lead to substantial tax liability, further complicated by the inability to set off losses. This necessitates a highly strategic approach to portfolio management. Indian investors must meticulously track their cost basis, understand the implications of the 1% TDS, and plan their sell orders carefully, especially when considering profit booking or rebalancing. The “Net Tax Liability after TDS adjustment” is the real figure that impacts an investor’s take-home profits, making precise calculations and professional tax advice indispensable in this evolving regulatory landscape.
The Single Most Important Thing for Indian Crypto Investors to Watch Tomorrow
For Indian crypto investors, the single most important thing to watch in the next 24-48 hours is the ETH/BTC ratio. Currently at 0.0282, its movement will be a pivotal indicator of broader market sentiment. If the ratio begins to show a sustained upward trend, pushing towards 0.0290 or even 0.0300, it would strongly signal a return of capital into altcoins, indicating that investors are becoming more comfortable taking on higher risk beyond Bitcoin. This shift could usher in a more robust “altcoin season” and provide significant tailwinds for assets like Ethereum (currently $1,765 / ₹168,275) and Solana (currently $80.67 / ₹7,691). Conversely, if the ratio continues to decline or stagnate, it would suggest that Bitcoin’s dominance is likely to persist, and altcoins may continue to struggle for significant independent gains, making a Bitcoin-heavy portfolio potentially more prudent for short-to-medium term capital preservation.
Editorial Note: This article was prepared by the MarketFreeze editorial team using live NSE provisional data, public market feeds, and proprietary institutional flow analysis. All price and flow figures are sourced directly from NSE, BSE, and CoinGecko as of 06 July 2026. This content is for informational purposes only and does not constitute investment advice. MarketFreeze is not SEBI-registered. Please consult a qualified financial advisor before making investment decisions. Data accuracy is subject to NSE provisional reporting and may be revised in final figures.