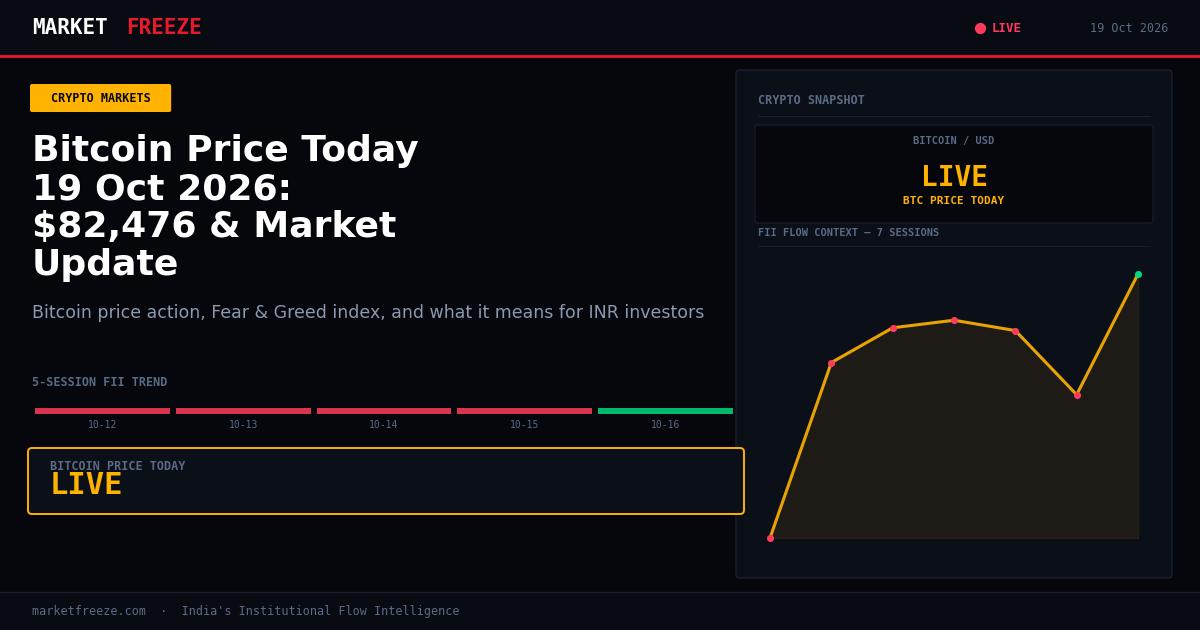
Bitcoin is trading at $82,476 USD, equivalent to ₹7,850,065 INR, marking a +1.21% increase in the last 24 hours. This modest rise in the digital gold comes as global equity markets show signs of a rebound following last week’s declines, with tech futures showing an early bounce. The crypto market appears to be shrugging off any lingering “Black Monday” anxieties, with Bitcoin extending its bounce above the $82,000 mark. The strategy firm mentioned in today’s news, which recently acquired $22 million in Bitcoin, now holds a substantial 848,517 BTC, acquired at an average price of $75,446 USD, underscoring institutional conviction in the asset.
Open a free demat account with
Upstox
or
Angel One
— zero brokerage on delivery trades.
Bitcoin’s Upside Momentum Amidst Equity Rebound
Bitcoin’s ascent to $82,476 USD (₹7,850,065 INR) mirrors the broader market’s cautious optimism. The news that Bitcoin edges higher as U.S. stocks rebound early Monday provides a clear correlation. The tech futures bounce, after a significant 5.5% rout last week, signals a potential easing of risk aversion. This recovery in traditional markets often translates into increased investor confidence, which can spill over into riskier assets like cryptocurrencies. The fact that Bitcoin is extending its bounce above $82,000 USD, as reported in live updates, suggests strong buying interest at these levels. The mention of China’s GDP beating estimates is a positive macro indicator that likely underpins this broader market recovery, offering a stable backdrop for Bitcoin’s continued upward movement. The strategy firm’s aggressive Bitcoin acquisition, as detailed in their recent filings, adds another layer of fundamental support, demonstrating sustained institutional belief and capital deployment into the asset.
Ethereum’s Steady Performance and ETH/BTC Dynamics
Ethereum is currently priced at $2,421 USD, or ₹230,430 INR, with a 24-hour gain of +1.04%. While this represents a solid performance, it lags slightly behind Bitcoin’s +1.21%. The ETH/BTC ratio stands at 0.0294. This ratio indicates that Bitcoin is holding steadier and showing slightly more relative strength compared to Ethereum today. Investors closely watch this ratio as it can signal shifts in capital allocation between the two largest cryptocurrencies. A sustained move lower in the ETH/BTC ratio could suggest a preference for Bitcoin’s perceived safety or a rotation into other altcoins showing stronger momentum. However, the absolute gains for Ethereum are still positive, reflecting a general upward trend in the crypto market. The fact that Ethereum is also experiencing gains, albeit at a slightly lower percentage, confirms that the broader crypto ecosystem is benefiting from the current market conditions, driven by the positive sentiment originating from traditional markets.
Solana’s Altcoin Leadership and Market Sentiment
Solana is demonstrating robust performance today, trading at $105.22 USD, which translates to ₹10,014 INR, with an impressive +2.23% gain in the last 24 hours. This strong showing positions Solana as a leader among altcoins today, outpacing both Bitcoin and Ethereum in percentage terms. This altcoin strength, particularly from a major player like Solana, suggests that a “risk-on” sentiment is indeed prevalent, with investors willing to explore assets beyond the top two cryptocurrencies. The news that DeFi tokens are leading altcoin gains further corroborates this. As DeFi continues to innovate and capture market attention, assets within this sector, including Solana which has a significant DeFi ecosystem, tend to benefit disproportionately. This suggests that capital is actively flowing into promising segments of the crypto market, seeking higher returns.
Fear and Greed Index Nears Neutrality
The Crypto Fear & Greed Index currently stands at 59/100, indicating a state of “Greed.” Historically, readings within the 45-60 range, as per the provided context, are often seen as transitional phases. They can precede significant directional moves in either asset prices or market sentiment, making the index itself less useful as a direct contrarian signal during these periods. A reading of 59 suggests that while there is optimism in the market, it has not yet reached extreme levels of euphoria that might signal an impending correction. Investors should be mindful that this “Greed” zone, while positive, can also imply a market that is becoming increasingly susceptible to pullbacks if positive momentum falters. The current level suggests a market that is confident but not overly frothy, leaving room for further upside potential before entering overheated territory.
FII Flows and Their Crypto Implications
Today’s FII net flow in Indian equities stands at ₹0 Cr, indicating net buyers. This lack of significant selling pressure from Foreign Institutional Investors (FIIs) is a positive sign for Indian equities, providing a stable backdrop. While today’s FII figure is neutral, the preceding sessions show a mixed trend. Notably, October 15th saw a significant outflow of ₹-5,285.37 Cr from FIIs, followed by a reversal on October 16th with a net inflow of +₹1,165.92 Cr. This fluctuating FII behavior underscores the importance of monitoring their flow data. Historically, when FIIs are net buyers and exhibit sustained inflows, it often correlates with a more positive risk sentiment, which can indirectly benefit crypto markets as investors seek broader diversification. Conversely, large FII outflows can signal a deleveraging or risk-off move that might also impact crypto. The current neutral flow today, following a period of volatility, suggests a cautious but stable institutional stance in Indian equities, which could provide a steady environment for domestic investors to consider crypto allocations.
Understanding Crypto Tax on Today’s Bitcoin Gains
Let’s consider a scenario for Indian retail investors. Suppose an investor purchased 0.1 BTC, approximately ₹850,000 INR (assuming an earlier purchase price of ₹8,500,000 INR per BTC) and today decides to sell it when Bitcoin is at ₹7,850,065 INR. The selling value would be ₹785,006.50 INR. In this hypothetical scenario, the investor would have realized a loss of approximately ₹64,993.50 INR. Under India’s current crypto tax regime, such losses can only be offset against gains from the sale of virtual digital assets. They cannot be set off against other income sources. This means if the investor has no other crypto gains in the same financial year, this loss cannot be utilized for tax benefits. It is crucial for investors to meticulously track all their crypto transactions to accurately calculate gains and losses for tax reporting purposes.
Key Levels to Watch for Nifty and Crypto
The Nifty closed at 22888.95 on October 16th. Following a period of FII outflows, the subsequent inflow and today’s neutral flow suggest a market consolidating around current levels. Key support for the Nifty can be observed near the 22,500 mark, a level that has previously acted as a psychological barrier and where DII buying has been consistent over the past few sessions, as seen in the table. Resistance for the Nifty might lie around the 23,000-23,150 zone, a level tested multiple times recently, particularly around October 14th and 15th. For Bitcoin, the current trading price of $82,476 USD (₹7,850,065 INR) places it in a strong upward trend. Key support can be eyed around the $80,000 USD (₹7,600,000 INR) level, which has acted as a base for recent upward moves. Resistance would be at new all-time highs, with initial psychological resistance around the $85,000 USD (₹8,075,000 INR) mark.
| Date | FII Net (Cr) | DII Net (Cr) | Nifty Close |
|---|---|---|---|
| 2026-10-12 | ₹-1,708.48 Cr | +₹3,045.02 Cr | 22,363.35 |
| 2026-10-13 | ₹-1,305.13 Cr | +₹2,439.24 Cr | 22,622.70 |
| 2026-10-14 | ₹-1,857.44 Cr | +₹2,670.44 Cr | 22,997.35 |
| 2026-10-15 | ₹-5,285.37 Cr | +₹3,319.39 Cr | 23,146.15 |
| 2026-10-16 | +₹1,165.92 Cr | ₹-3,661.28 Cr | 22,888.95 |
Frequently Asked Questions
Q: What did FII buy or sell on 2026-10-15?
A: FIIs were net sellers on 2026-10-15, with net sales of ₹-5,285.37 Cr.
Q: What did DII buy on 2026-10-14?
A: Domestic Institutional Investors (DIIs) were net buyers on 2026-10-14, with net purchases of +₹2,670.44 Cr.
Q: Is FII buying or selling in October 2026?
A: FII activity in October 2026 has been mixed. While there were significant outflows in the earlier part of the month, such as on October 15th (₹-5,285.37 Cr), there were also periods of inflows, with a notable inflow of +₹1,165.92 Cr on October 16th. Today’s figure of ₹0 Cr indicates a pause or neutral stance.
USD/INR Impact on Indian Crypto Returns
The current USD/INR rate stands at ₹95.18. For Indian retail investors holding cryptocurrencies denominated in USD, like Bitcoin ($82,476 USD) and Ethereum ($2,421 USD), the exchange rate plays a crucial role in their actual INR returns. A strengthening INR (a decrease in USD/INR) would diminish the INR value of their crypto holdings, while a weakening INR (an increase in USD/INR) would inflate it, assuming the crypto prices in USD remain constant. Today, with the USD/INR at ₹95.18, the INR is relatively stable. If the INR were to weaken significantly, say to ₹96.00, the INR value of 1 BTC would increase by approximately 0.86% ( (96-95.18)/95.18 ), boosting the Rupee-denominated gains for Indian investors, provided the BTC/USD price doesn’t fall commensurately. Conversely, a strengthening INR would have the opposite effect, eroding potential gains or amplifying losses in INR terms.
Actionable Framework: Capitalizing on Altcoin Strength
Given Solana’s significant +2.23% gain and the broader trend of DeFi tokens leading altcoin gains, a potential framework for Indian investors could involve strategically allocating a small portion of their portfolio to select altcoins demonstrating strong momentum, provided their risk tolerance allows. The current “Greed” reading (59/100) suggests that the market is optimistic, which often favors altcoins. If Solana can sustain its upward trajectory and break above $110 USD (₹10,470 INR), it could signal further upside potential, potentially reaching towards $120 USD (₹11,410 INR). Investors might consider initiating a small position if Solana retests the $100 USD (₹9,510 INR) level with strong buying volume. However, strict stop-losses are essential, perhaps just below the $95 USD (₹9,040 INR) mark, to mitigate downside risk in case of a sudden market reversal. This approach focuses on capitalizing on identified sector strength while managing risk.
Bottom Line
Bitcoin is trading steadily at $82,476 USD (₹7,850,065 INR), supported by a broader market rebound. Ethereum is also showing positive gains, though Bitcoin is currently outperforming it on a relative basis. Solana is a standout performer among altcoins today, indicating a healthy risk-on sentiment within the crypto space. The Fear & Greed Index at 59 suggests investor confidence is high but not yet euphoric. FII flows in Indian equities are currently neutral, providing a stable backdrop. Investors should remain vigilant of the USD/INR exchange rate for their actual INR returns and consider strategic allocations within the crypto market, mindful of risk management.
Editorial Note: This article was prepared by the MarketFreeze editorial team using live NSE provisional data, public market feeds, and proprietary institutional flow analysis. All price and flow figures are sourced directly from NSE, BSE, and CoinGecko as of 19 October 2026. This content is for informational purposes only and does not constitute investment advice. MarketFreeze is not SEBI-registered. Please consult a qualified financial advisor before making investment decisions. Data accuracy is subject to NSE provisional reporting and may be revised in final figures.