Indian Equities Tumble as RBI Stance and Soaring Crude Prices Dent Sentiment; FIIs Deepen Sell-off
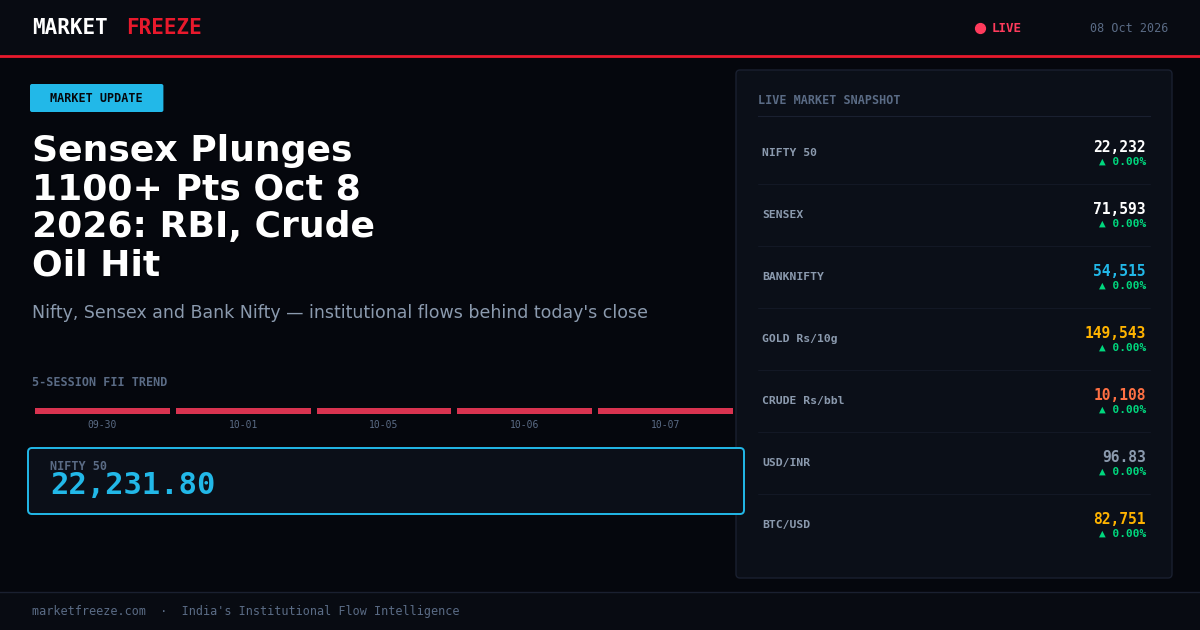
Indian equity markets experienced a significant downturn today, October 8, 2026, with the Nifty 50 shedding 1.64% to close at 22,231.80 and the Sensex falling 1.44% to 71,593.00, a decline primarily fueled by a hawkish stance from the Reserve Bank of India (RBI) and a sharp surge in crude oil prices. Foreign Institutional Investors (FIIs) amplified the selling pressure, recording a net sell of ₹6,121.37 Cr, the largest outflow in the last three sessions, while Domestic Institutional Investors (DIIs) continued their buying spree with a net buy of ₹4,596.57 Cr.
Open a free demat account with
Upstox
or
Angel One
— zero brokerage on delivery trades.
RBI’s Monetary Policy Tightening and Crude Oil Shock Drive Market Plunge
The market’s sharp decline today was predominantly triggered by two potent factors: the RBI’s increasingly hawkish monetary policy signals and the alarming rise in global crude oil prices. While the RBI has been progressively signaling a tighter monetary stance to combat inflation, today’s commentary suggested a longer path to rate cuts than previously anticipated, increasing borrowing costs for businesses and dampening investor sentiment. Simultaneously, crude oil prices on MCX surged by 4.18% to ₹10,108.00 per barrel, raising concerns about India’s import bill, inflationary pressures, and corporate margins, particularly for energy-intensive sectors.
FIIs Accelerate Selling Amidst Macroeconomic Headwinds
Foreign Institutional Investors (FIIs) significantly intensified their selling activity today, offloading equities worth a net of ₹6,121.37 Cr. This marked the third consecutive session of substantial FII outflows, totaling ₹13,781.81 Cr over the last three trading days. This aggressive selling by foreign entities directly correlates with the heightened macroeconomic uncertainties stemming from the RBI’s hawkish posture and the escalating crude oil prices, which typically prompt foreign investors to de-risk their portfolios in emerging markets like India.
DIIs Provide Support Amidst FII Exodus
In stark contrast to FIIs, Domestic Institutional Investors (DIIs) continued their consistent buying, net purchasing ₹4,596.57 Cr worth of equities today. This is the third consecutive session where DIIs have been net buyers, having deployed ₹14,282.01 Cr in the last three days. DIIs appear to be leveraging the market dips to accumulate positions, potentially viewing the current price levels as attractive for long-term investment, thereby providing a crucial buffer against the aggressive selling pressure from FIIs.
Sectoral Carnage: Metals and Realty Lead the Decline
The broad-based sell-off today saw all sectors trading in the red. However, the Metal and Realty sectors bore the brunt of the market’s ire, emerging as the top sectoral losers. The sharp increase in crude oil prices directly impacts the input costs for metal producers, while higher interest rates signaled by the RBI will likely dampen demand for real estate, affecting construction activities and property sales. The banking sector, while down 0.98% in the Bank Nifty, also faced pressure due to potential headwinds from tighter monetary policy impacting loan growth and asset quality.
FII/DII Flow: A Three-Session Snapshot
The following table illustrates the net FII and DII flows over the last three trading sessions, highlighting the persistent selling by FIIs and consistent buying by DIIs:
| Date | FII Net (Cr) | DII Net (Cr) | Nifty Close |
|---|---|---|---|
| 2026-10-07 | ₹-6,121.37 | +₹4,596.57 | 22,603.05 |
| 2026-10-06 | ₹-2,961.30 | +₹5,088.92 | 22,776.10 |
| 2026-10-05 | ₹-4,699.14 | +₹5,181.62 | 22,776.10 |
Historical FII/DII Flows and Market Performance
Analyzing the recent FII/DII flow data reveals a consistent trend of foreign outflows and domestic inflows over the past five trading sessions, even as the Nifty has seen fluctuations. This divergence in institutional behavior underscores differing market perspectives. While FIIs are increasingly cautious, likely due to global economic concerns and India-specific inflation risks amplified by crude prices, DIIs are demonstrating a strong conviction in the domestic market’s long-term prospects.
| Date | FII Net (Cr) | DII Net (Cr) | Nifty Close |
|---|---|---|---|
| 2026-09-30 | ₹-10,148.41 | +₹11,271.73 | 22,421.95 |
| 2026-10-01 | ₹-9,484.22 | +₹10,041.84 | 22,555.75 |
| 2026-10-05 | ₹-4,699.14 | +₹5,181.62 | 22,776.10 |
| 2026-10-06 | ₹-2,961.30 | +₹5,088.92 | 22,776.10 |
| 2026-10-07 | ₹-6,121.37 | +₹4,596.57 | 22,603.05 |
Currency and Commodity Crosscurrents: USD/INR and Crude Oil Dynamics
The Indian Rupee weakened against the US Dollar, with USD/INR trading at Rs96.83, a gain of 0.43%. This depreciation is a direct consequence of the elevated crude oil prices, which increase India’s import bill and put downward pressure on the rupee. Furthermore, FII outflows typically reduce the dollar inflows into the country, exacerbating the rupee’s weakness. Gold prices on MCX saw a marginal uptick of 0.09% to ₹149,543.00 per 10 grams, often acting as a safe-haven asset during periods of geopolitical and economic uncertainty.
Key Levels to Watch: Nifty Support and Resistance from Flow Data
Based on recent institutional activity, the Nifty 50’s immediate support is observed around the 22,000-22,100 mark, where DII buying has been prominent in recent sessions, particularly during dips. Conversely, resistance is likely to be encountered around the 22,500-22,600 range, an area where FII selling pressure has been consistently observed, especially at higher levels preceding today’s sharp fall.
FAQ Section
Q: What did FII buy or sell on 07 October 2026? A: FIIs were net sellers, offloading equities worth ₹6,121.37 Cr on 07 October 2026.
Q: What did DII buy on 07 October 2026? A: DIIs were net buyers, purchasing equities worth ₹4,596.57 Cr on 07 October 2026.
Q: Is FII buying or selling in October 2026? A: In October 2026, FIIs have consistently been net sellers, with significant outflows observed in the initial trading days.
Portfolio Framework: Navigating the Current Market Environment
Investors should consider a tactical reallocation towards sectors with lower crude oil price sensitivity and potential beneficiaries of domestic demand. For instance, a portfolio could allocate 15-20% to defensive sectors like FMCG, which often perform well during economic slowdowns. Simultaneously, reducing exposure to highly cyclical sectors like Metals and Realty, potentially by 10-15%, is advisable until there is a clearer resolution to the crude oil price surge and the RBI’s monetary policy trajectory. A small allocation of 5-8% to high-quality IT services companies, which are less affected by domestic macroeconomic factors and benefit from global IT spending, could also be considered, especially in anticipation of earnings results such as TCS’s Q2 announcement. Maintaining a higher allocation to Gold, around 8-10% of the portfolio, could serve as a hedge against inflation and geopolitical risks.
What Changes This Outlook?
The primary trigger to watch for a potential shift in market sentiment would be a sustained stabilization or decline in crude oil prices below the $9,500 per barrel mark on MCX. Additionally, any dovish signals from the RBI, perhaps suggesting a faster-than-expected easing of monetary policy, or a significant reversal in FII flows with sustained net buying exceeding ₹5,000 Cr in a single session, could alter the current bearish outlook.
Bottom Line
Today’s market action was a stark reflection of mounting macroeconomic concerns, led by a hawkish RBI and soaring crude oil prices, which prompted FIIs to execute significant sell-offs. Despite the broad-based sectoral declines, particularly in Metals and Realty, DIIs continued their supportive buying, indicating a divergence in institutional sentiment. Investors should closely monitor crude oil dynamics and the RBI’s future policy pronouncements for cues on market direction.
Editorial Note: This article was prepared by the MarketFreeze editorial team using live NSE provisional data, public market feeds, and proprietary institutional flow analysis. All price and flow figures are sourced directly from NSE, BSE, and CoinGecko as of 08 October 2026. This content is for informational purposes only and does not constitute investment advice. MarketFreeze is not SEBI-registered. Please consult a qualified financial advisor before making investment decisions. Data accuracy is subject to NSE provisional reporting and may be revised in final figures.