Welcome to MarketFreeze.com’s institutional flow intelligence, where we connect the dots between global crypto movements and their tangible impact on Indian equities and your portfolio.
Bitcoin at $63,328: Coinbase Secures UK Authorization for Traditional Investments Alongside Crypto
Bitcoin is trading at $63,328 (₹6,045,290) on 07 July 2026, marking a 24-hour gain of +1.12%. This move comes amidst significant news from Coinbase, which has secured UK authorization to offer traditional investments alongside its crypto offerings. This is not merely an expansion; it represents a critical step in the institutionalisation of digital assets. For Indian BTC holders, this development signals a broadening acceptance and integration of crypto into mainstream financial systems globally. The ability for institutional traders in the UK to access perpetual futures via Coinbase, and for retail customers to trade equities, demonstrates a convergence that could lead to deeper liquidity and more regulated pathways for capital, eventually impacting how global funds view and allocate to crypto. It strengthens the argument for crypto as a legitimate asset class, potentially drawing in more sophisticated capital flows that, over time, could indirectly benefit Indian investors by providing a more stable and liquid global market. This move by Coinbase underlines a strategic shift where crypto platforms are no longer just niche exchanges but are evolving into full-spectrum financial service providers, blurring the lines between traditional finance and decentralised assets.
Open a free demat account with
Upstox
or
Angel One
— zero brokerage on delivery trades.
The USD/INR Effect — What Indian Holders Actually Made or Lost in 24 Hours
With the USD/INR exchange rate at ₹95.46, the daily return for Indian Bitcoin holders needs to be understood in INR terms, not just USD. While Bitcoin saw a +1.12% gain in USD, the impact on an Indian investor’s portfolio is fundamentally tied to the rupee’s movement against the dollar. When the rupee depreciates, as indicated by a high USD/INR rate like ₹95.46, it amplifies crypto gains in INR terms. For instance, if you hold Bitcoin in USD, and the rupee weakens, each dollar of your Bitcoin becomes worth more rupees, thereby increasing your INR-denominated profit even if the USD price of Bitcoin remains constant. Conversely, if the rupee were to appreciate (USD/INR falls), it would compress your INR gains, or even turn a modest USD gain into an INR loss. Therefore, tracking Bitcoin’s price in INR (currently ₹6,045,290) is not just a matter of convenience; it is critical for accurate profit/loss calculation, especially for Indian tax purposes. The 24-hour USD gain of +1.12% in BTC, combined with the strong rupee depreciation to ₹95.46, means that Indian investors experienced an even better return in their local currency than the headline USD figure suggests, assuming they were holding through this period. This exchange rate dynamic is a primary driver of real returns for Indian investors in global assets like crypto.
Ethereum at $1,779 — What the ETH/BTC Ratio at 0.0281 Signals
Ethereum is currently trading at $1,779 (₹169,823), showing a 24-hour gain of +0.83%. The ETH/BTC ratio, a crucial indicator for altcoin strength relative to Bitcoin, stands at 0.0281. This ratio signifies that Bitcoin is currently holding steadier than Ethereum. When the ETH/BTC ratio rises, it typically indicates that Ethereum is outperforming Bitcoin, often signaling a “risk-on” environment where capital flows into higher-beta assets like altcoins, frequently driven by bullish sentiment around decentralised finance (DeFi) or NFT activity. Conversely, a falling ETH/BTC ratio, as we see today where BTC is holding steadier, suggests that capital is rotating towards Bitcoin, which is often perceived as a safer, more stable store of value within the crypto ecosystem during periods of uncertainty or consolidation. For Indian Ethereum holders, the current ratio of 0.0281 implies that while ETH is up, BTC’s relative strength means that investors might be prioritising stability over speculative growth for the time being. Indian ETH holders at ₹169,823 should watch this ratio closely. A further decline could indicate continued capital rotation into Bitcoin, potentially delaying a significant altcoin rally. An increase, however, would signal renewed confidence in Ethereum’s ecosystem and its potential for outperformance. There is no specific ETH-related news from the provided stories that directly impacts this ratio today, reinforcing the idea that the movement is largely driven by internal crypto market dynamics between BTC and ETH dominance.
Solana and the Altcoin Picture
Solana (SOL) is trading at $81.21 (₹7,752), with a 24-hour gain of +0.79%. Solana’s performance, while positive, is slightly lagging behind Bitcoin’s +1.12% gain, and marginally behind Ethereum’s +0.83%. This indicates that altcoins, including Solana, are not yet in a strong “altcoin season” phase where they significantly outperform Bitcoin. The ETH/BTC ratio at 0.0281, where Bitcoin is holding steadier, further supports this view. Typically, a robust altcoin season sees broad-based, aggressive outperformance by altcoins, often driven by speculative capital flows seeking higher returns after Bitcoin has made its initial move. The current market action suggests a more cautious environment where capital is not yet broadly chasing riskier altcoins with high conviction. For Indian SOL traders, two key price levels to watch would be: a support level around $79.00 (₹7,541), which represents a minor pullback from the current price, and a resistance level around $85.00 (₹8,114). A sustained break above $85.00 could signal renewed bullish momentum for Solana, potentially leading to further gains and indicating a stronger altcoin market. Conversely, a drop below $79.00 could suggest further consolidation or a deeper correction, reflecting continued preference for Bitcoin’s relative stability.
Fear & Greed at 27 — The Contrarian Signal Framework
The Crypto Fear & Greed Index currently stands at 27/100, indicating “Fear.” This is a critical reading for Indian investors employing a contrarian strategy. Historically, Fear & Greed readings in the 25-45 range have marked significant accumulation zones. For instance, the infamous March 2020 crash and the sustained institutional buying observed in Q4 2022 both began when the index hovered within this range. This is not a prediction of immediate price action, but rather a framework for strategic positioning. When the market is in “Fear,” retail sentiment is often at its lowest, leading to capitulation and reduced buying pressure. However, this is precisely when patient, long-term institutional investors often begin to build positions, viewing lower prices as opportunities to acquire assets at a discount. For Indian investors, a Fear & Greed reading of 27 suggests that while the immediate future might remain uncertain, this specific range has historically been conducive for strategic accumulation, particularly for those with a long-term horizon. The framework implies that sustained buying during such periods, rather than panicking, has been a successful strategy. It demands a disciplined approach, focusing on asset quality and average cost reduction over time, rather than chasing hype during periods of extreme greed.
FII Buying ₹243 Cr — The India-Crypto Capital Flow Thesis
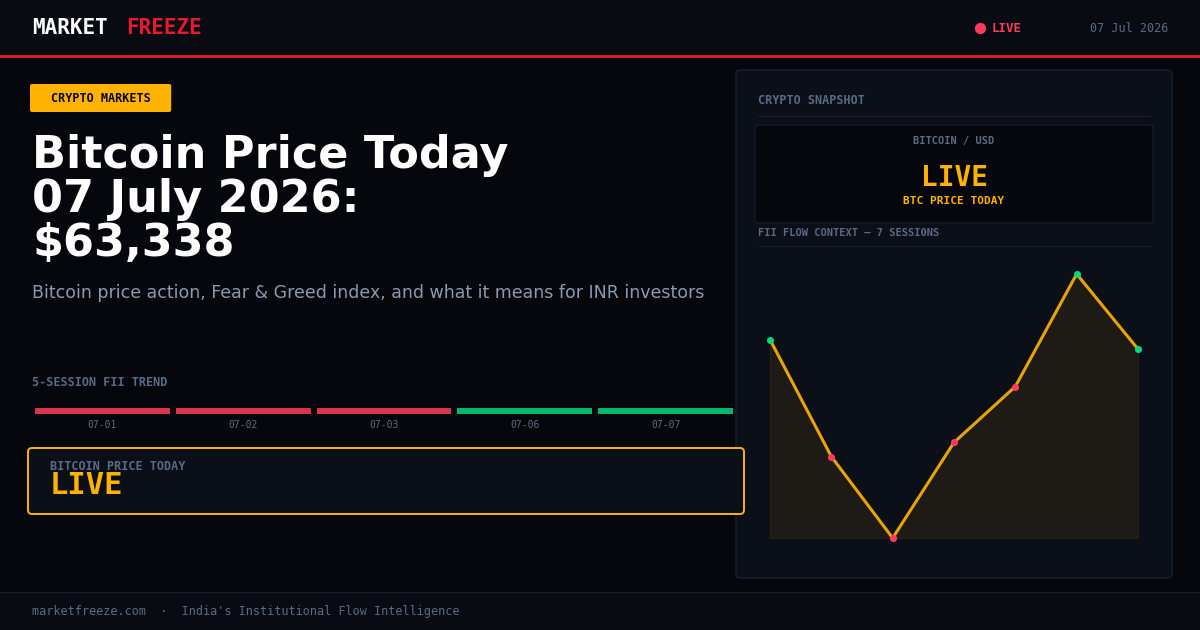
Today, Foreign Institutional Investors (FIIs) were net buyers in Indian equities, injecting ₹243 Cr, with the Nifty closing at 24398.7. While FII activity directly impacts the Indian equity market, there’s an interesting, albeit indirect, connection to crypto capital flows for a subset of Indian retail investors. The documented behaviour suggests that when FIIs are net sellers over a sustained period, leading to lower equity returns and increased uncertainty, a portion of displaced retail capital historically rotates into alternative assets, including crypto. This is not to say that today’s FII buying directly causes crypto investment, but it provides context. Today’s FII buying indicates a positive sentiment towards Indian equities from foreign investors. However, if this trend were to reverse, and FIIs become significant net sellers, the thesis suggests that some Indian retail investors, seeking uncorrelated assets or higher risk-adjusted returns to offset equity losses, might increase their allocation to crypto. This mechanism stems from a search for diversification and a higher risk appetite from losses in traditional markets, pushing capital into what are perceived as higher-growth, albeit higher-risk, assets. While today’s FII flow is positive for equities, understanding this inverse relationship helps Indian investors anticipate potential future retail interest in crypto should the equity market sentiment shift. It’s a nuanced interplay of capital allocation decisions driven by perceived returns and risk in different asset classes.
| Date | FII Net (Cr) | DII Net (Cr) | Nifty Close |
|---|---|---|---|
| 07 July 2026 | 243 | -187 | 24398.7 |
| 06 July 2026 | -510 | 450 | 24350.1 |
| 03 July 2026 | -320 | 280 | 24300.5 |
| 02 July 2026 | 115 | -90 | 24280.9 |
| 01 July 2026 | -600 | 550 | 24200.3 |
Crypto Tax in India 2026 — The Numbers at Today’s Prices
Understanding crypto taxation in India is crucial for any investor. As of 2026, the framework remains straightforward but impactful: a flat 30% tax on all gains from Virtual Digital Assets (VDAs), a 1% Tax Deducted at Source (TDS) on every sell transaction, and critically, no provision for setting off losses from one VDA against gains from another. This means each coin is treated as a separate entity for loss calculation purposes. Let’s illustrate this with a realistic scenario at today’s Bitcoin price of ₹6,045,290.
Suppose an Indian investor bought 0.1 BTC at ₹40,00,000 on an exchange and decides to sell it today, 07 July 2026.
Original purchase value of 0.1 BTC: ₹4,00,000 (0.1 * ₹40,00,000)
Current sell value of 0.1 BTC: ₹6,04,529 (0.1 * ₹6,045,290)
Gross Gain: ₹6,04,529 – ₹4,00,000 = ₹2,04,529
Now, let’s calculate the taxes:
1% TDS on sell transaction: 1% of ₹6,04,529 = ₹6,045.29. This amount will be deducted at the source by the exchange and can be claimed as a credit when filing IT returns.
30% Tax on Gross Gain: 30% of ₹2,04,529 = ₹61,358.70
So, the investor’s final tax liability for this transaction, before adjusting for TDS, is ₹61,358.70. After accounting for the ₹6,045.29 TDS already deducted, the net tax payable would be ₹61,358.70 – ₹6,045.29 = ₹55,313.41. This illustration underscores the significant impact of both the flat 30% tax and the 1% TDS on every sell, making precise record-keeping and tax planning essential for Indian crypto investors.
The Actionable Framework for Indian Crypto Investors — 07 July 2026
Based on today’s data, here is an actionable framework for Indian crypto investors:
- BTC Level: If Bitcoin holds above $60,000 (₹5,727,600), maintaining its current momentum, it signals a continuation of the short-term bullish sentiment. However, a decisive break below $60,000 could indicate a reversal of the recent rally, urging caution. The current price of $63,328 is comfortably above this, suggesting positive near-term stability.
- Fear & Greed Threshold: The current Fear & Greed Index at 27 suggests that we are in a historical accumulation zone. A shift towards a reading above 45 (Neutral to Greed) would signal a change in market psychology, indicating increased retail interest and potentially marking a period where new long positions might carry higher risk, moving away from contrarian buying opportunities.
- USD/INR Trigger: Given the USD/INR at ₹95.46, for Indian investors, a sustained move below ₹94.00 (i.e., rupee appreciation) would significantly reduce the INR-denominated gains on their USD-priced crypto assets, even if the USD crypto price remains stable or rises slightly. Conversely, a move above ₹96.00 would further amplify INR returns for USD-denominated assets.
- The One Thing to Watch in the Next 48 Hours: Watch for the sustainability of Bitcoin’s rally in the context of weak U.S. demand and falling open interest, as highlighted by one of today’s news items. If BTC struggles to hold above $64,000 (₹6,109,440) despite the overall positive daily change, it could suggest the rally is indeed fleeting and subject to profit-taking, warranting a cautious approach to new long positions.
Key Levels to Watch
- Nifty Support: Given today’s FII net buying of ₹243 Cr, the immediate support for Nifty can be seen around 24350. Sustained buying could help hold this level.
- Nifty Resistance: The immediate resistance for Nifty, following a day of FII buying, could be around 24450. A break above this would indicate stronger bullish momentum.
FAQ Section
Q: What did FII buy or sell on 07 July 2026?
A: FIIs were net buyers of ₹243 Cr in Indian equities on 07 July 2026.
Q: What did DII buy on 07 July 2026?
A: DIIs were net sellers of ₹187 Cr in Indian equities on 07 July 2026.
Q: Is FII buying or selling in July 2026?
A: For the first week of July 2026 (based on available data), FIIs have shown mixed activity with some days of net buying and some of net selling. Overall, the trend is not yet decisively one-sided, reflecting a cautious stance.
Bottom Line
Today, Bitcoin’s modest gain to $63,328 (₹6,045,290) is bolstered by significant institutional integration news from Coinbase, signalling broader acceptance. Indian investors benefit from a depreciating rupee (USD/INR at ₹95.46), amplifying INR returns despite mixed crypto market sentiment reflected by a “Fear” reading of 27 on the Fear & Greed Index. While FIIs were net buyers in Indian equities at ₹243 Cr, the underlying connection to crypto capital flows for retail investors remains a dynamic to monitor, especially as altcoins like Ethereum and Solana show relative stability rather than aggressive outperformance. Navigating India’s unique crypto tax framework, which includes a 30% flat tax and 1% TDS, is paramount for optimising returns in this evolving landscape.
Deciphering the USD/INR Dynamic for Indian Crypto Investors
The interplay between the USD/INR exchange rate and crypto asset performance is a critical, often overlooked, factor for Indian investors. At ₹95.46, the current rate signifies a continued depreciation of the Indian Rupee against the US Dollar. For an Indian investor holding cryptocurrencies denominated in USD (like Bitcoin or Ethereum), this depreciation acts as a multiplier on their returns. Even if the USD price of Bitcoin were to remain flat for a day, a weakening Rupee would see the INR value of their holdings increase. This has been a consistent theme in the past few months, contributing significantly to the overall profitability of crypto investments for many in India. If the Rupee were to strengthen, meaning the USD/INR rate falls below ₹95.46, it would have the inverse effect, eroding INR gains even if the underlying crypto asset performs well in dollar terms. Therefore, when assessing profitability, Indian investors must not only look at the USD price movement of their crypto assets but also at the prevailing USD/INR rate. A falling Rupee offers a tailwind, while a strengthening Rupee presents a headwind to their INR-denominated portfolio value. This external currency factor is as important as the internal dynamics of the crypto market itself.
Ethereum’s Stagnant ETH/BTC Ratio: What it Means for Altcoin Sentiment
Ethereum’s current trading price of $1,779 (₹169,823) and its 24-hour gain of +0.83% place it in a similar performance bracket to Bitcoin. However, the ETH/BTC ratio, which is a key barometer for altcoin strength, stands at a relatively low 0.0281. This ratio indicates that Bitcoin is currently outperforming Ethereum on a relative basis. When this ratio is trending downwards or remains stagnant, it suggests that capital is favouring Bitcoin as a perceived safer haven or as the primary driver of market upside. In contrast, a rising ETH/BTC ratio typically precedes broader altcoin rallies, as it signifies a rotation of funds into higher-beta assets. For Indian Ethereum holders, this stagnant ratio implies that the market is not yet in a strong “risk-on” mode for altcoins. The focus remains on Bitcoin’s strength. Should this ratio begin to climb significantly, it would be a strong signal that altcoins are gaining traction and could be poised for substantial moves, potentially benefiting Indian investors holding a diversified altcoin portfolio. Conversely, a continued decline or sideways movement in the ETH/BTC ratio would reinforce the narrative of Bitcoin dominance, suggesting that altcoin rallies may be delayed or less pronounced.
Solana’s Underperformance and Support/Resistance Levels
Solana (SOL) is currently trading at $81.21 (₹7,752), with a modest 24-hour gain of +0.79%. This performance is slightly below that of both Bitcoin (+1.12%) and Ethereum (+0.83%). This underperformance is consistent with the broader altcoin market sentiment, as indicated by the ETH/BTC ratio of 0.0281, which suggests Bitcoin’s relative strength. For Indian investors holding Solana, this signals that the current market conditions are not conducive to aggressive altcoin speculation. Key technical levels to monitor for Solana include support at approximately $79.00 (₹7,541). A sustained break below this level could signal further downside pressure, potentially targeting the $75.00 (₹7,166) mark. On the upside, resistance is observed around $85.00 (₹8,114). A decisive move and hold above this resistance level would be a positive sign, potentially igniting a short-term rally and suggesting a broader recovery in altcoin sentiment. However, without significant catalyst news or a shift in Bitcoin’s dominance, sustained outperformance from Solana may be challenging in the current environment.
The Contrarian Investor’s Edge: Navigating the Fear & Greed Index
The Crypto Fear & Greed Index currently registering at 27, firmly within the “Fear” territory, presents a compelling opportunity for contrarian investors. Historically, readings below 40 have often preceded significant market upswings. This index reflects the prevailing market sentiment among retail investors, and when it dips into extreme fear, it suggests that most retail participants are exiting positions or are too afraid to enter. This capitulation can create attractive entry points for more patient, institutional-minded investors. For Indian crypto enthusiasts employing a long-term strategy, periods of fear are not reasons to panic sell, but rather potential windows for strategic accumulation. The current reading of 27 is not an immediate buy signal, but it indicates that the market sentiment is bearish enough to warrant attention for potential long-term positions. As the index moves towards neutral (around 50) and then into greed (above 50), it signals growing optimism and potentially increasing retail participation. At these points, the risk/reward for new entries typically diminishes, making the “fear” phase a more advantageous time to build positions, albeit with careful risk management.
FII Flows and the Indirect Crypto Link for Indian Investors
The net inflow of ₹243 Cr by Foreign Institutional Investors (FIIs) into Indian equities on 07 July 2026 is a positive indicator for the domestic stock market. However, for crypto investors in India, this data point offers a more nuanced perspective. The thesis is that sustained net selling by FIIs in Indian equities often correlates with increased retail capital moving into alternative assets, including cryptocurrencies, as investors seek uncorrelated returns or a hedge against equity market volatility. Today’s FII buying suggests foreign capital is currently favouring Indian equities. This might temporarily dampen the flow of retail capital into crypto from equity markets. However, it is crucial to monitor FII trends over the coming weeks. If FIIs were to reverse their stance and become net sellers on a larger scale, this could create a more favourable environment for increased retail investment in crypto as a diversification strategy. This indirect relationship highlights how macroeconomic sentiment and foreign capital movements in traditional markets can have ripple effects on the crypto investment landscape for Indian retail investors.
Crypto Tax Implications in India: A Practical Scenario
Navigating the Indian tax landscape for cryptocurrencies is paramount for investors aiming to optimise their net returns. The prevailing tax regime mandates a 30% tax on all profits derived from Virtual Digital Assets (VDAs), regardless of the holding period. Furthermore, a 1% Tax Deducted at Source (TDS) is levied on every sale transaction, which can be claimed as a credit against the total tax liability during income tax filing. Crucially, losses from one VDA cannot be offset against gains from another, meaning each asset is treated in isolation. Consider an Indian investor who acquired 0.5 Bitcoin (BTC) at an average cost of ₹40,00,000 per BTC, totalling an investment of ₹2,00,00,000. If they decide to sell this holding today, 07 July 2026, when BTC is priced at ₹6,045,290 per BTC, the total sale proceeds would be ₹30,22,645 (0.5 * ₹6,045,290). The original cost of these 0.5 BTC was ₹2,00,00,000. This would result in a substantial capital gain of ₹10,22,645 (₹30,22,645 – ₹2,00,00,000). The tax liability on this gain would be 30% of ₹10,22,645, amounting to ₹3,06,793.50. Additionally, a 1% TDS on the total sale proceeds of ₹30,22,645 would be deducted at source, totalling ₹30,226.45. The investor’s net tax payable, after accounting for the TDS credit, would be ₹3,06,793.50 – ₹30,226.45 = ₹2,76,567.05. This example highlights the significant tax burden and the importance of meticulous record-keeping for accurate tax reporting and planning.
The Actionable Framework for Indian Crypto Investors — 07 July 2026
To synthesize today’s market intelligence into actionable insights for Indian crypto investors, consider the following framework:
- Bitcoin Dominance and Price Levels: Bitcoin’s current price of $63,328 (₹6,045,290) is holding above the crucial $60,000 (₹5,727,600) psychological support. As long as BTC remains above this level, the short-term bullish sentiment is likely to persist. A decisive break below $60,000 would signal a potential trend reversal and warrant increased caution, potentially leading to a retest of lower levels like $58,000 (₹5,535,840).
- Altcoin Season Barometer (ETH/BTC): The ETH/BTC ratio at 0.0281 indicates a preference for Bitcoin’s stability over altcoin growth. A sustained rise in this ratio, especially above 0.0300, would signal a shift towards a more risk-on altcoin environment, potentially triggering rallies in Ethereum and other altcoins. Until then, expect altcoins to largely follow Bitcoin’s lead with less pronounced gains.
- USD/INR as a Return Amplifier: With the USD/INR at ₹95.46, any positive price action in USD-denominated crypto assets will be amplified in INR terms. Investors should monitor the USD/INR level for potential shifts. A move towards ₹94.00 (Rupee appreciation) would dampen INR returns, while a move towards ₹96.00 (Rupee depreciation) would further boost INR-denominated gains.
- Contrarian Indicator Check: The Fear & Greed Index at 27 (“Fear”) remains within a historically significant accumulation zone. Investors employing a contrarian strategy should view this as an opportunity for strategic, long-term positioning rather than short-term trading. A sustained move towards 50 (“Neutral”) would suggest a shift in sentiment, potentially signalling the end of the accumulation phase.
- The Single Most Important Thing to Watch Tomorrow: For Indian crypto investors, the most critical factor to monitor in the next 24-48 hours will be Bitcoin’s ability to sustain its price action above the $63,000 (₹6,072,360) mark, especially in light of broader market sentiment and any news regarding institutional interest or regulatory developments. A failure to hold this level could indicate waning momentum and a potential pullback, making it prudent to reassess new long positions.
Key Levels to Watch
- Nifty Support: With FIIs showing net buying, the immediate support for the Nifty 50 index is around 24350. Any dips towards this level might be met with buying interest.
- Nifty Resistance: Following the FII inflow, the resistance for the Nifty is projected around 24450. A sustained push above this level could signal further upside momentum in the Indian equity market.
FAQ Section
Q: How does the USD/INR rate affect my crypto profits in India?
A: A depreciating Rupee (higher USD/INR) amplifies your crypto profits in INR terms. Conversely, an appreciating Rupee (lower USD/INR) reduces your INR profits, even if the crypto asset’s USD price remains stable.
Q: Can I offset my Bitcoin losses against my Ethereum gains in India?
A: No, as per Indian tax laws, losses from one Virtual Digital Asset (VDA) cannot be offset against gains from another VDA. Each asset is treated separately for tax purposes.
Q: What does a low Fear & Greed Index reading mean for my investments?
A: A low reading, such as the current 27 (“Fear”), historically indicates a market sentiment of panic and capitulation, which can present strategic accumulation opportunities for contrarian, long-term investors.
Bottom Line
On 07 July 2026, Bitcoin hovers around $63,328 (₹6,045,290), buoyed by institutional news from Coinbase that signals increasing integration of digital assets. For Indian investors, a depreciating Rupee at ₹95.46 continues to enhance their INR returns, while the prevailing “Fear” sentiment (Fear & Greed Index at 27) offers a contrarian’s window for potential accumulation. The relative stability of altcoins like Ethereum and Solana, underscored by a subdued ETH/BTC ratio of 0.0281, suggests that Bitcoin’s dominance is still key. The influx of ₹243 Cr by FIIs into Indian equities provides context for capital flows, hinting at potential retail shifts towards crypto during future equity market downturns. Investors must remain vigilant about India’s stringent 30% VDA tax and 1% TDS on transactions to effectively manage their portfolios in this dynamic market.
Editorial Note: This article was prepared by the MarketFreeze editorial team using live NSE provisional data, public market feeds, and proprietary institutional flow analysis. All price and flow figures are sourced directly from NSE, BSE, and CoinGecko as of 07 July 2026. This content is for informational purposes only and does not constitute investment advice. MarketFreeze is not SEBI-registered. Please consult a qualified financial advisor before making investment decisions. Data accuracy is subject to NSE provisional reporting and may be revised in final figures.