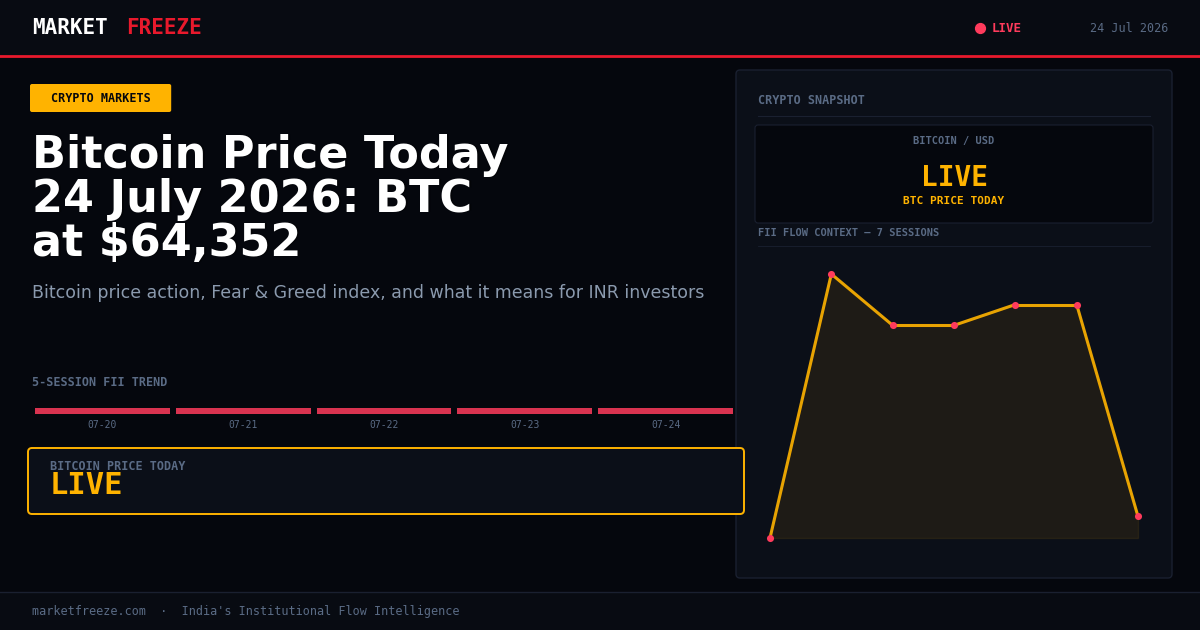
Welcome to MarketFreeze.com’s institutional flow intelligence. Today, Bitcoin (BTC) stands at $64,372 USD or ₹6,226,059 INR, experiencing a modest dip of -0.94% over the past 24 hours. This slight retraction comes as the European Union unveils its 21st sanctions package targeting a massive $120 billion crypto network linked to Russia, considering a ban on third-country crypto service providers and naming 14 undisclosed crypto companies. This development, while directly impacting specific entities, casts a broad shadow over the regulatory landscape, potentially influencing institutional confidence in certain segments of the digital asset market.
EU Sanctions Target Crypto, Raising Regulatory Stakes for Institutional Flows
The latest announcement from the European Union, detailing its 21st sanctions package, marks a significant escalation in the regulatory scrutiny of the crypto space. By directly targeting a $120 billion crypto network associated with Russia and contemplating a ban on third-country crypto service providers, the EU is sending a clear signal about its intent to control the flow of digital assets. For Indian institutional investors, this move warrants close attention. While the immediate impact might be felt by specific entities and the broader European market, the precedent set by such comprehensive sanctions can influence global regulatory frameworks. Increased regulatory pressure often leads to a more formalized and potentially restricted environment for institutional capital moving into and out of crypto. The un-named 14 crypto companies now under the EU’s lens highlight the ever-present risk of regulatory action, compelling institutions to prioritize compliance and due diligence in their crypto ventures. Today’s slight downturn in Bitcoin’s price to $64,372 USD (₹6,226,059 INR) and Ethereum’s to $1,866 USD (₹180,479 INR) could be attributed, in part, to a general cautious sentiment emerging from such significant geopolitical and regulatory developments, as institutional players re-evaluate their exposure.
Open a free demat account with
Upstox
or
Angel One
— zero brokerage on delivery trades.
Indian Holders Navigate Currency Headwinds as USD/INR Touches ₹96.72
For Indian crypto investors, the movement of the USD/INR exchange rate is as critical as the underlying crypto price itself. Today, with the USD/INR standing at ₹96.72, the depreciation of the Rupee continues to provide a marginal buffer against the -0.94% decline in Bitcoin’s USD value. While Bitcoin in USD terms moved from yesterday’s close to $64,372, its Rupee equivalent is calculated at ₹6,226,059. Had the USD/INR remained static, a direct -0.94% fall on an earlier Rupee equivalent would have been more pronounced. However, the stronger Dollar means that even a slight dip in the dollar price of crypto translates to a less severe, or in some scenarios, even a relative gain for Indian holders when measured in Rupees. This dynamic is especially relevant for institutional treasuries holding crypto assets, as a stronger USD can partially offset market corrections in their dollar-denominated holdings. It underscores the importance of monitoring global forex movements in conjunction with crypto price action for a holistic view of portfolio performance in India.
Ethereum Underperforms Bitcoin Amidst Broader Market Weakness
Today’s crypto market sees Ethereum (ETH) trading at $1,866 USD or ₹180,479 INR, a decline of -1.64% over the last 24 hours. This performance places ETH behind Bitcoin (BTC), which saw a comparatively smaller dip of -0.94%. The ETH/BTC ratio currently stands at 0.029, indicating that Bitcoin is indeed outperforming Ethereum today. This divergence can be significant for institutional strategies that often involve hedging or arbitrage opportunities between the two largest cryptocurrencies. When ETH underperforms BTC, it can signal a rotation of capital towards what is perceived as a more stable or less risky asset during periods of uncertainty. The broader market weakness, possibly influenced by the EU sanctions news, seems to be driving capital into Bitcoin as a relative safe haven within the crypto ecosystem. Institutional investors with diversified crypto portfolios will be observing this ratio closely, as sustained underperformance of ETH could trigger rebalancing decisions.
Solana Faces Steeper Decline as Altcoin Market Feels the Pinch
While Bitcoin and Ethereum registered moderate declines, the altcoin market, as exemplified by Solana (SOL), experienced a more pronounced downturn today. Solana is trading at $74.55 USD or ₹7,210 INR, reflecting a substantial -2.76% drop in the last 24 hours. This steeper fall in Solana’s value compared to BTC and ETH highlights a typical market dynamic during periods of increased caution or selling pressure: altcoins, generally perceived as higher-risk assets, tend to suffer larger percentage losses. For institutional investors with exposure to a diversified altcoin portfolio, today’s movements underscore the importance of risk management strategies, including position sizing and stop-loss orders. The news of crypto market maker B2C2 having held sale talks, albeit with valuation as a sticking point, could also be contributing to a general sentiment of consolidation and potential re-evaluation within the broader crypto industry, impacting altcoins disproportionately. This scenario often leads institutional funds to reduce their exposure to more speculative assets, directing capital towards more established cryptocurrencies or even out of the market entirely.
Fear & Greed Index Points to “Fear” at 28/100: A Historical Accumulation Zone
Today’s Crypto Fear & Greed Index registers a reading of 28/100, firmly within the “Fear” territory. This specific range, historically, has been a significant indicator for institutional accumulation. Recalling past market cycles, the 2020 March crash and the 2022 Q4 period both saw the index consistently hovering between 25-45, which subsequently marked the beginning of sustained institutional buying. For sophisticated Indian investors, this current reading suggests a potential strategic entry point rather than a signal for panic. While prices across the board, including Bitcoin at $64,372 USD (₹6,226,059 INR) and Ethereum at $1,866 USD (₹180,479 INR), are experiencing corrections, the “Fear” sentiment often presents an opportunity for those with a long-term perspective to acquire assets at potentially undervalued levels. Institutions often leverage such sentiment shifts, buying when retail investors are fearful, thereby positioning themselves for future uptrends. This current “Fear” reading aligns with a strategy of gradual accumulation, especially given the historical precedents.
FIIs Continue Selling Spree: ₹3,893 Cr Outflow from Indian Equities
Today, Foreign Institutional Investors (FIIs) were net sellers in the Indian equity markets, offloading a substantial ₹3,892.77 Cr. This marks a significant outflow and continues a recent trend of FII divestment, as evidenced by the past five trading sessions. While Domestic Institutional Investors (DIIs) provided some counterbalance by buying ₹5,453.55 Cr, the persistent FII selling exerts downward pressure on the Nifty, which closed at 23767.45. This sustained FII outflow is a critical data point for the crypto capital flow thesis. When FIIs withdraw significant capital from Indian equities, a portion of this capital often seeks alternative investment avenues globally, and increasingly, digital assets have become a consideration for global institutional treasuries. While not a direct one-to-one correlation, a large FII outflow from traditional markets can indirectly signal a reallocation of global capital, some of which may find its way into crypto markets that offer different risk-reward profiles or perceived diversification benefits. The magnitude of today’s FII selling reinforces the idea that institutional capital is actively re-evaluating its positions across various asset classes.
Illustrating Crypto Tax Mechanics with Today’s Bitcoin Price
Understanding the tax implications of crypto investments is paramount for Indian investors, especially with prices like Bitcoin’s at ₹6,226,059 INR. Let’s consider a scenario: an Indian institution or high-net-worth individual decides to sell a portion of their Bitcoin holdings today. Suppose they had acquired 0.5 BTC at an average price of ₹5,500,000 INR per BTC. Today, selling 0.5 BTC at ₹6,226,059 INR per BTC would yield ₹3,113,029.50 INR. The cost of acquisition for 0.5 BTC would have been ₹2,750,000 INR. This results in a capital gain of ₹363,029.50 INR. Under current Indian tax regulations, any gains from crypto assets are taxed at a flat rate of 30%, irrespective of the holding period. Additionally, a 1% TDS (Tax Deducted at Source) would have been applied at the time of sale. For this transaction, the 1% TDS would be ₹31,130.30 INR on the sale value of ₹3,113,029.50 INR. This TDS amount can be adjusted against the final tax liability. This illustration highlights that despite a negative price movement today, past gains can still incur significant tax liabilities, making tax planning an integral part of crypto investment strategy in India. The absence of offsetting losses against gains from other asset classes further emphasizes the need for careful consideration of entry and exit points.
Actionable Framework: Spotting Accumulation with FII Flows and Fear Index
For Indian institutional investors, combining FII flow data with the Crypto Fear & Greed Index offers a powerful framework for identifying potential accumulation phases. Here’s a 3-point strategy based on today’s data:
- 1. Monitor Sustained FII Outflows: Today’s FII net selling of ₹3,892.77 Cr, coupled with the consistent outflows over the past five sessions (e.g., ₹-1,121.04 Cr on 20th and 21st July, ₹-819.20 Cr on 22nd and 23rd July), suggests a broader reallocation of capital. If this trend continues, a portion of this global institutional capital may seek refuge or opportunity in the crypto markets. Investors should look for at least 3-5 consecutive days of significant FII selling (above ₹1,000 Cr) as a potential trigger.
- 2. Confirm with “Fear” Readings: A Fear & Greed Index reading consistently in the 25-45 range, such as today’s 28/100, historically correlates with institutional accumulation. This indicates a period where market sentiment is low, offering potentially attractive entry points for long-term holders. Look for the index to sustain itself in this “Fear” zone for at least a week to confirm the sentiment.
- 3. Observe Crypto Price Stability/Consolidation: While today’s Bitcoin price of $64,372 USD (₹6,226,059 INR) shows a slight dip, a true accumulation phase would be characterized by price consolidation rather than a freefall, especially after FII outflows and high “Fear.” Look for Bitcoin to hold above key support levels, possibly around the $62,000-$63,000 USD range, or show signs of bottoming formation within the next few days. This confluence of FII selling in equities, pronounced “Fear” in crypto, and crypto price stability signals a high-conviction accumulation zone for institutional players.
Historical FII/DII Data — Last 5 Sessions
| Date | FII Net (Cr) | DII Net (Cr) | Nifty Close |
|---|---|---|---|
| 2026-07-20 | ₹-1,121.04 Cr | +₹1,312.03 Cr | 24,238.50 |
| 2026-07-21 | ₹-1,121.04 Cr | +₹1,312.03 Cr | 24,187.70 |
| 2026-07-22 | ₹-819.20 Cr | ₹-418.26 Cr | 23,996.25 |
| 2026-07-23 | ₹-819.20 Cr | ₹-418.26 Cr | 23,869.60 |
| 2026-07-24 | ₹-3,892.77 Cr | +₹5,453.55 Cr | 23,767.45 |
Key Levels to Watch
Given the significant FII net selling of ₹3,892.77 Cr today and the Nifty closing at 23767.45, the Indian equity market is showing signs of weakness. For the Nifty, immediate support can be identified around the 23,700 level, based on the recent downward trend. A breach below this could see the Nifty testing further support at 23,550, a level last observed during stronger FII selling pressures. On the resistance side, the 23,900-24,000 band, which previously served as support, now acts as a key resistance zone. Until FII flows reverse their selling trend and DII buying intensifies to fully absorb the outflows, upside attempts in the Nifty may encounter strong selling pressure around these resistance levels. Institutional investors should closely monitor these thresholds for signs of either a potential bounce or further market correction in Indian equities.
FAQ
Q: What did FII buy or sell on 24 July 2026?
A: Foreign Institutional Investors (FIIs) were net sellers, offloading ₹3,892.77 Cr from Indian equities on 24 July 2026.
Q: What did DII buy on 24 July 2026?
A: Domestic Institutional Investors (DIIs) were net buyers, injecting +₹5,453.55 Cr into Indian equities on 24 July 2026.
Q: Is FII buying or selling in July 2026?
A: Based on the past five trading sessions, FIIs have been consistently net sellers in July 2026, with significant outflows noted, including ₹-3,892.77 Cr on 24th July.
Bottom Line
Today’s market action showcases a confluence of external regulatory pressures and domestic institutional dynamics. The EU’s expanded sanctions on a $120 billion crypto network underscore the evolving regulatory landscape, contributing to a cautious sentiment that saw Bitcoin dip to $64,372 USD (₹6,226,059 INR) and Ethereum to $1,866 USD (₹180,479 INR). Simultaneously, the Crypto Fear & Greed Index at 28/100 signals “Fear,” a historically notable accumulation zone for institutional players. In India, a substantial FII outflow of ₹3,892.77 Cr from equities, though partially offset by DII buying, suggests a broader capital reallocation, potentially directing global institutional attention towards undervalued crypto assets for diversification. Savvy investors are likely using this period of fear and FII selling to evaluate strategic entry points into digital assets.
Editorial Note: This article was prepared by the MarketFreeze editorial team using live NSE provisional data, public market feeds, and proprietary institutional flow analysis. All price and flow figures are sourced directly from NSE, BSE, and CoinGecko as of 24 July 2026. This content is for informational purposes only and does not constitute investment advice. MarketFreeze is not SEBI-registered. Please consult a qualified financial advisor before making investment decisions. Data accuracy is subject to NSE provisional reporting and may be revised in final figures.