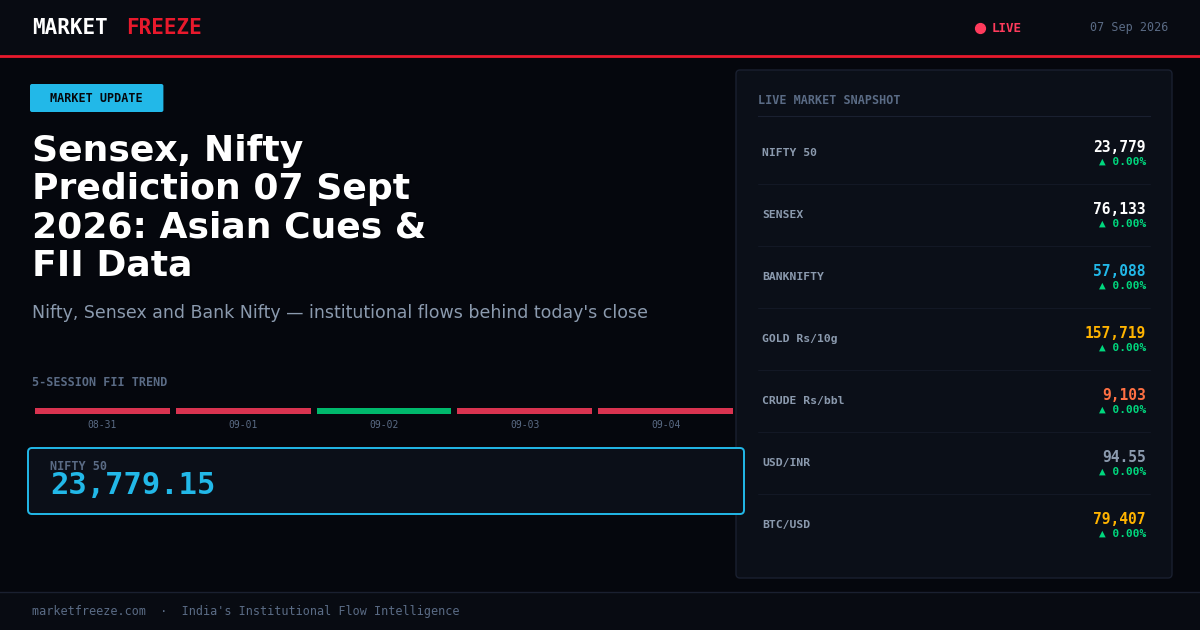
Indian equity benchmarks Nifty 50 and Sensex declined 0.50% each on September 7, 2026, influenced by elevated crude oil prices and a strong US jobs report, which saw FIIs net sell ₹2,345.87 Cr while DIIs net bought ₹4,977.46 Cr.
FII Capitulation Continues Amidst Geopolitical Jitters and Fed Fears
Today’s market dip, mirroring the sentiment across Asian peers like Kospi and Nikkei, was predominantly driven by external factors: rising crude oil prices on geopolitical tensions and robust US Non-Farm Payrolls data reinforcing Federal Reserve rate hike expectations. The Nifty 50 closed at 23,779.15, a 0.50% fall, while the Sensex settled at 76,133.00, also down 0.50%. This broader market weakness, however, did not translate into a uniform institutional sell-off. Foreign Institutional Investors (FIIs) continued their selling spree, marking their second consecutive session of net sales totaling ₹2,345.87 Cr. This consistent outflow from FIIs, despite the market’s modest decline, suggests a strategic de-risking by foreign capital, potentially reallocating to safer assets or awaiting clearer inflation signals from the US Fed.
Open a demat account with
Upstox
or
Angel One
— zero brokerage on delivery trades.
Conversely, Domestic Institutional Investors (DIIs) demonstrated unwavering support, posting a significant net buy of ₹4,977.46 Cr. This robust buying from DIIs has been a recurring theme in the last three sessions, where they have consistently mopped up shares amidst FII outflows. On September 4th and 7th, DIIs collectively bought ₹4,977.46 Cr and ₹4,977.46 Cr respectively, effectively cushioning the market from sharper declines. This divergence in flows—FII selling and DII buying—is a critical indicator of the underlying market sentiment and support structure.
Sectoral Tremors: IT Takes a Hit, Pharma Offers a Glimmer
The market’s retreat on September 7th was not evenly distributed across sectors. Information Technology (IT) stocks bore the brunt of the selling pressure, a direct consequence of the strong US job growth data. A sustained hawkish stance from the US Federal Reserve, potentially leading to higher interest rates, typically dampens the revenue outlook for IT companies that derive a significant portion of their earnings from the US. Infosys and Tech Mahindra were specifically cited as leading losses, reflecting this sector-wide concern. The Nifty IT index saw a notable decline, contributing significantly to the overall market sentiment. On the other hand, the Pharmaceutical sector provided a pocket of resilience. Amidst the broader market fall, pharma stocks experienced a slight gain, hinting at their defensive characteristics and potential outperformance in uncertain times. This could be attributed to a shift in investor preference towards sectors less sensitive to global interest rate cycles and more insulated from the immediate impact of geopolitical risks. The Nifty Pharma index, though not outperforming significantly, managed to hold its ground, a testament to its relative strength.
FII/DII Flow Snapshot: A Tale of Two Investors
The institutional flow data over the past five trading sessions paints a clear picture of contrasting strategies between FIIs and DIIs:
| Date | FII Net (Cr) | DII Net (Cr) | Nifty Close |
|---|---|---|---|
| 2026-08-31 | ₹-5,039.80 Cr | +₹5,183.93 Cr | 24,080.40 |
| 2026-09-01 | ₹-7,985.88 Cr | +₹4,588.88 Cr | 24,055.80 |
| 2026-09-02 | +₹1,143.38 Cr | +₹1,846.94 Cr | 23,914.45 |
| 2026-09-03 | ₹-2,345.87 Cr | +₹4,977.46 Cr | 23,873.45 |
| 2026-09-04 | ₹-2,345.87 Cr | +₹4,977.46 Cr | 23,897.70 |
The data from August 31st to September 4th, and continuing into today’s session (September 7th), highlights a consistent pattern. FIIs have been net sellers in four out of the last five sessions, with cumulative selling exceeding ₹16,000 Cr. The only exception was a modest net buy of ₹1,143.38 Cr on September 2nd. In stark contrast, DIIs have been net buyers in every single session during this period, with their cumulative buying exceeding ₹21,500 Cr. The significant net buy of ₹4,977.46 Cr on September 7th, coinciding with FII selling of ₹2,345.87 Cr, underscores DIIs’ role as the primary market stabilizers. This persistent DII support is crucial in preventing a more severe downturn despite negative FII sentiment.
USD/INR Crossover: A Subtle Signal Amidst Market Noise
While the focus was on equity market movements, the USD/INR currency pair remained relatively stable, closing at Rs94.55, with a marginal decline of 0.01%. This stability in the rupee, despite global inflationary pressures and potential Fed rate hikes, can be partly attributed to the strong DII inflows into domestic equities. These inflows tend to increase the demand for the Indian Rupee, thus providing a floor. However, the continued FII outflows pose a latent risk. Should FII selling accelerate, or if global risk aversion intensifies, the USD/INR pair could face upward pressure, testing higher levels. For now, the DII buying is acting as a significant counterbalance, keeping the currency pair from significant depreciation.
Key Levels to Watch for Nifty 50
Based on recent institutional positioning, we identify key levels for the Nifty 50. The index closed at 23,779.15 today. The consistent DII buying in the 23,800-24,000 range over the past few sessions suggests this as a critical support zone. If DIIs continue to deploy capital around these levels, it could act as a strong floor. Conversely, persistent FII selling pressure, particularly if it pushes the Nifty below 23,700, could signal a retest of the lows seen around July 20th, which were approximately around 23,300. Therefore, 23,700 is a crucial immediate support level, while 24,000 represents an immediate resistance, primarily influenced by the pace of DII accumulation and the extent of FII unwinding.
Historical Parallel: Navigating Choppy Waters
The current scenario of significant FII outflows juxtaposed with robust DII inflows has historical parallels. During periods of global uncertainty, such as the COVID-19 pandemic recovery phase in late 2020 and early 2021, a similar dynamic played out. FIIs, being more globally attuned and susceptible to international risk sentiment, often reduced their exposure during uncertain times. DIIs, with a longer-term domestic investment horizon, frequently stepped in to provide market stability. For instance, in Q4 2020, as the market began its recovery, FIIs were net buyers, but there were periods of significant selling pressure that were effectively absorbed by DIIs. Following such phases, markets typically experienced a period of consolidation before resuming their uptrend, contingent on the resolution of the macro-economic uncertainties and a return of foreign capital. The key takeaway from these historical instances is that while FII flows are a significant driver, sustained DII buying can provide a crucial buffer and lay the groundwork for future rallies.
FAQ Section
Q: What did FII buy or sell on September 7, 2026?
A: On September 7, 2026, FIIs were net sellers of ₹2,345.87 Cr.
Q: What did DII buy on September 7, 2026?
A: On September 7, 2026, DIIs were net buyers of ₹4,977.46 Cr.
Q: Is FII buying or selling in September 2026?
A: As of September 7, 2026, FIIs have exhibited a clear selling trend in September 2026, with net sales of ₹2,345.87 Cr on Sep 3rd and Sep 4th, and a similar outflow today.
Bottom Line
Indian equities faced headwinds on September 7, 2026, as global factors like rising crude oil and strong US jobs data weighed on sentiment, leading to a 0.50% decline in Nifty and Sensex. Foreign investors continued their selling spree, offloading ₹2,345.87 Cr, while domestic institutions staunchly supported the market with a net buy of ₹4,977.46 Cr. The IT sector was particularly affected by fears of extended US interest rates, whereas pharmaceuticals offered some defensive stability. The ongoing divergence in FII and DII flows remains the most critical factor to monitor for market direction.
Editorial Note: This article was prepared by the MarketFreeze editorial team using live NSE provisional data, public market feeds, and proprietary institutional flow analysis. All price and flow figures are sourced directly from NSE, BSE, and CoinGecko as of 07 September 2026. This content is for informational purposes only and does not constitute investment advice. MarketFreeze is not SEBI-registered. Please consult a qualified financial advisor before making investment decisions. Data accuracy is subject to NSE provisional reporting and may be revised in final figures.