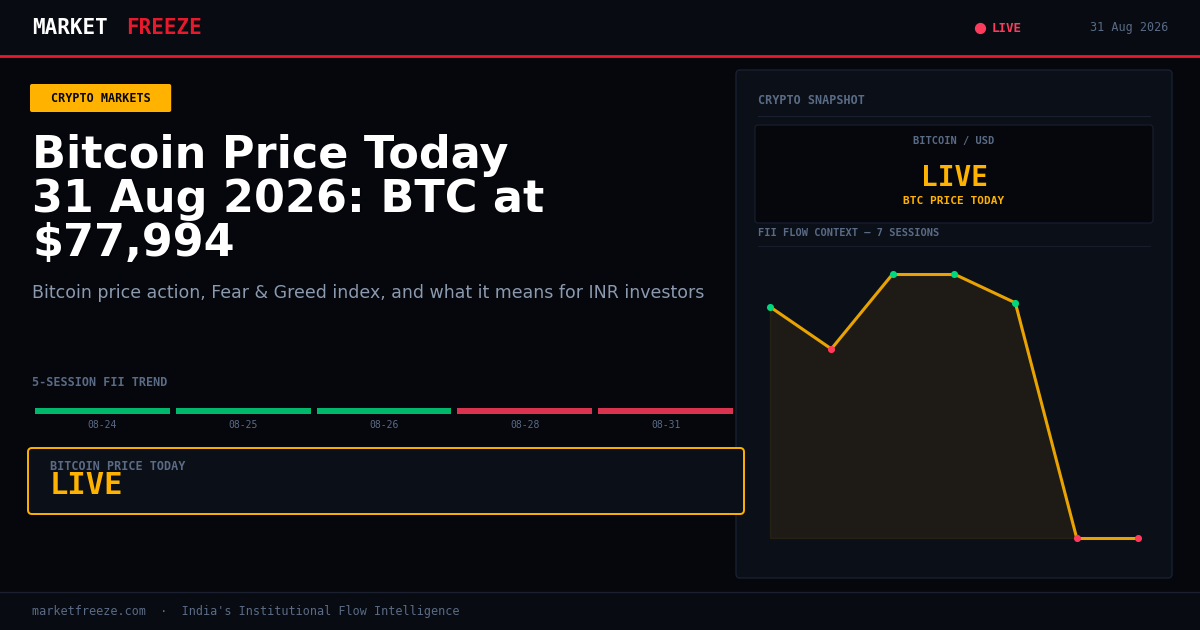
Bitcoin is trading at $77,975 USD or ₹7,452,850 INR, down 0.93% in the last 24 hours. This morning’s crypto market activity sees a notable shift as institutional strategies appear to be re-engaging with Bitcoin. One of the leading digital asset investment firms has reportedly returned to its Bitcoin buying strategy, adding approximately $370 million USD of BTC in the past week. This marks their first significant Bitcoin acquisition in nearly two months, signaling a renewed conviction in the asset despite broader market jitters.
Open a free demat account with
Upstox
or
Angel One
— zero brokerage on delivery trades.
Bitcoin Re-Accumulation Signals Institutional Confidence Amidst Shifting Flows
The recent announcement that a major investment firm has purchased $370 million USD worth of Bitcoin, its first such acquisition in approximately two months, is a critical development for the digital asset class. This strategic re-entry into BTC, at an average cost of $80,318 USD (which is about 29% higher than their earlier summer sales), suggests a strong belief in Bitcoin’s long-term trajectory. While today’s broader crypto market, including Ethereum at $2,449 USD or ₹234,075 INR (down 0.71%), and Solana at $102.71 USD or ₹9,817 INR (down 3.41%), shows some caution, this significant Bitcoin buy-in indicates a discerning institutional approach. This move could potentially serve as a leading indicator for further institutional capital deployment into Bitcoin, especially if broader market conditions stabilize. The INR value of this purchase, considering the current USD/INR rate of ₹95.58, translates to a substantial ₹35,349,180,000 INR, highlighting the scale of institutional commitment.
Indian Rupee Dynamics: Hedging Crypto Gains in a Weakening INR Environment
The current USD/INR exchange rate stands at ₹95.58. For Indian retail investors holding cryptocurrencies denominated in USD, such as Bitcoin and Ethereum, a weakening INR generally translates into higher INR returns, assuming the crypto asset’s USD price remains constant or appreciates. For example, if an investor bought Bitcoin at $70,000 USD when the USD/INR was ₹90.00, their purchase cost was ₹6,300,000 INR. Today, if Bitcoin were still at $70,000 USD but the USD/INR has moved to ₹95.58, the INR value of that holding would be ₹6,690,600 INR, representing an unrealized gain of ₹390,600 INR purely due to currency fluctuations. Conversely, a strengthening INR would erode these currency-driven gains. The current trend in USD/INR, if sustained, offers a natural hedge against potential price drops in USD-denominated crypto assets, a crucial factor for Indian investors to consider when evaluating their overall portfolio performance.
Ethereum’s Performance and the ETH/BTC Ratio: A Tale of Divergent Strength
Ethereum is currently priced at $2,449 USD or ₹234,075 INR, experiencing a 0.71% decline in the past 24 hours. The ETH/BTC ratio stands at 0.0314. This ratio indicates that Bitcoin is currently demonstrating greater resilience compared to Ethereum. While both major cryptocurrencies are showing minor downturns, the fact that Bitcoin’s percentage decrease is larger than Ethereum’s suggests that BTC is holding steadier. This divergence is significant for investors who utilize the ETH/BTC ratio as a barometer for the relative strength between the two leading digital assets. A declining ETH/BTC ratio typically implies that Bitcoin is outperforming Ethereum. In the current environment, this trend suggests that capital might be gravitating towards the perceived safety or stronger momentum of Bitcoin, even as both assets experience modest price adjustments. This narrative is further amplified by the news of institutional buying in Bitcoin, which directly supports its relative strength.
Solana’s Sell-off and the Altcoin Landscape: A Day of Altcoin Weakness
Solana is trading at $102.71 USD or ₹9,817 INR, registering a notable decline of 3.41% over the last 24 hours. This significant drop in Solana’s price highlights a broader weakness within the altcoin market today. While Bitcoin and Ethereum are also experiencing modest price retracements, Solana’s larger percentage decrease indicates that investors may be de-risking from higher-beta altcoins. The news regarding Robinhood Chain beating Ethereum in daily revenue, driven by memecoin trading, points to a volatile and speculative segment within the broader crypto ecosystem. However, this success on Robinhood Chain does not appear to be spilling over positively into established altcoins like Solana. Instead, the current price action suggests a flight to perceived stability, with Bitcoin’s re-accumulation trend potentially drawing capital away from more speculative altcoin positions. The substantial drop in Solana underscores the importance of diversification and careful asset selection within the altcoin space, especially during periods of market uncertainty.
Investor Sentiment Dashboard: ‘Greed’ Zone Signals Potential for Short-Term Volatility
The Crypto Fear & Greed Index is currently at 62/100, indicating a state of ‘Greed’. Historically, readings above 60 have often preceded short-term corrections in the crypto market, typically ranging from 5% to 15% within a 2-4 week timeframe. While this ‘Greed’ reading suggests a generally optimistic outlook among investors, it also serves as a cautionary signal. The historical context provided indicates that such elevated levels of greed have, in the past, marked temporary peaks before a price pullback. However, it is also important to note that during exceptionally strong bull cycles, such as the period between 2020 and 2021, greed readings have sustained above 75 for extended periods. The current ‘Greed’ level, coupled with the significant FII selling observed in Indian equities today, warrants careful monitoring. It suggests that while speculative interest is high, a period of consolidation or a minor correction in crypto markets is a plausible scenario in the near term.
Indian Equities and FII Flows: A Divergent Picture in Institutional Capital
Today, Foreign Institutional Investors (FIIs) have been net sellers in Indian equities to the tune of ₹5,040 Cr. This marks a significant outflow, contrasting with the net buying activity observed in the previous sessions. The Nifty is currently at 24080.40. This substantial FII selling pressure on Indian bourses could be influenced by various global factors, including the performance of risk assets like cryptocurrencies and the broader macroeconomic environment. While FIIs are divesting from Indian stocks, the digital asset space is seeing some selective institutional interest, particularly in Bitcoin, as evidenced by the significant purchase reported earlier. This divergence highlights a potential shift in institutional capital allocation strategies, where some are reducing exposure to traditional emerging markets like India while increasing targeted investments in digital assets. For Indian retail investors, monitoring these FII flows is crucial as they often precede significant movements in the domestic equity market. The current trend of FII outflows warrants caution regarding the short-term outlook for Indian equities.
Crypto Tax Mechanics: Calculating Potential Tax Liabilities on Bitcoin Transactions
Let’s consider a hypothetical scenario for an Indian investor. Suppose an investor purchased 0.5 Bitcoin at $70,000 USD per BTC when the USD/INR rate was ₹90.00. The total purchase cost in INR would be 0.5 * $70,000 USD * ₹90.00/USD = ₹3,150,000 INR. Today, if that investor decides to sell this 0.5 Bitcoin when Bitcoin is at $77,975 USD and the USD/INR is at ₹95.58, the selling proceeds in INR would be 0.5 * $77,975 USD * ₹95.58/USD = ₹3,725,696.25 INR. Under Indian crypto tax laws, this sale would be subject to a 30% tax on the profits. The calculated profit is ₹3,725,696.25 INR – ₹3,150,000 INR = ₹575,696.25 INR. The tax liability on this profit would be approximately 30% of ₹575,696.25 INR = ₹172,708.88 INR. This calculation illustrates the importance of tracking both the USD price of the cryptocurrency and the prevailing USD/INR exchange rate to accurately determine gains and tax obligations for Indian investors.
Key Levels to Watch for Indian Equities Amidst FII Outflows
With FIIs turning net sellers to the tune of ₹5,040 Cr today, the Nifty is currently trading at 24080.40. Key support for the Nifty, considering this bearish flow, would be the 23900-24000 zone. A breach below this level could trigger further downside, potentially testing the 23750 mark. On the resistance side, the 24200-24300 band will act as an immediate hurdle. A decisive move above this resistance, especially if accompanied by a reversal in FII flows, could signal a stabilization. However, given the current selling pressure, a retest of lower levels seems more probable in the short term. The DIIs remain net buyers, providing some cushion, but the magnitude of FII selling today is a dominant factor influencing market direction.
Frequently Asked Questions
-
Q: What did FII buy or sell on 2026-08-28?
A: FIIs were net sellers of ₹-5,039.80 Cr on 2026-08-28. -
Q: What did DII buy on 2026-08-31?
A: DIIs were net buyers of ₹5,183.93 Cr on 2026-08-31. -
Q: Is FII buying or selling in August 2026?
A: FIIs have shown a mixed trend in August 2026. After consistent net buying in the first half of the month, they turned into significant net sellers in the latter half, as indicated by the substantial outflows on August 28th and August 31st.
A Numbered Framework for Navigating Today’s Market Conditions
- Bitcoin Support Threshold: If Bitcoin’s USD price falls below $77,000 USD (₹7,361,000 INR), it could indicate increased selling pressure, potentially triggering further declines towards the $75,000 USD (₹7,175,000 INR) level.
- Ethereum Relative Weakness Trigger: A sustained drop in the ETH/BTC ratio below 0.0310 would confirm Ethereum’s underperformance against Bitcoin, suggesting caution for ETH holders.
- Solana Sell-off Confirmation: If Solana’s USD price breaches the $100 USD (₹9,558,000 INR) mark, it would signal a continuation of its current downtrend, potentially targeting the $95 USD (₹9,080,100 INR) level.
- Nifty Breakdown Alert: A close below the Nifty’s 24000 support level, especially with continued FII selling, would suggest a further correction, with the next significant support around 23750.
Bottom Line
Today’s market presents a complex interplay of institutional capital movements. While Bitcoin shows signs of selective institutional accumulation, the broader crypto market, particularly altcoins like Solana, is experiencing a downturn. The significant FII outflows from Indian equities add another layer of caution to the domestic market outlook. Indian retail investors must carefully consider the USD/INR dynamics for their crypto holdings and remain vigilant of the ‘Greed’ signals in the crypto Fear & Greed Index, which historically suggest potential short-term volatility. Monitoring FII flows closely will be paramount for navigating both crypto and equity markets in the coming days.
Historical FII/DII Net Figures and Nifty Performance
The following table details the net FII and DII flows, along with the Nifty closing price, over the last five trading sessions:
| Date | FII Net (Cr) | DII Net (Cr) | Nifty Close |
|---|---|---|---|
| 2026-08-24 | +₹1,181.66 Cr | +₹2,493.41 Cr | 24,219.05 |
| 2026-08-25 | +₹1,181.66 Cr | +₹2,493.41 Cr | 24,334.55 |
| 2026-08-26 | +₹502.63 Cr | +₹6,425.16 Cr | 24,207.75 |
| 2026-08-28 | ₹-5,039.80 Cr | +₹5,183.93 Cr | 24,175.65 |
| 2026-08-31 | ₹-5,039.80 Cr | +₹5,183.93 Cr | 24,080.40 |
Editorial Note: This article was prepared by the MarketFreeze editorial team using live NSE provisional data, public market feeds, and proprietary institutional flow analysis. All price and flow figures are sourced directly from NSE, BSE, and CoinGecko as of 31 August 2026. This content is for informational purposes only and does not constitute investment advice. MarketFreeze is not SEBI-registered. Please consult a qualified financial advisor before making investment decisions. Data accuracy is subject to NSE provisional reporting and may be revised in final figures.