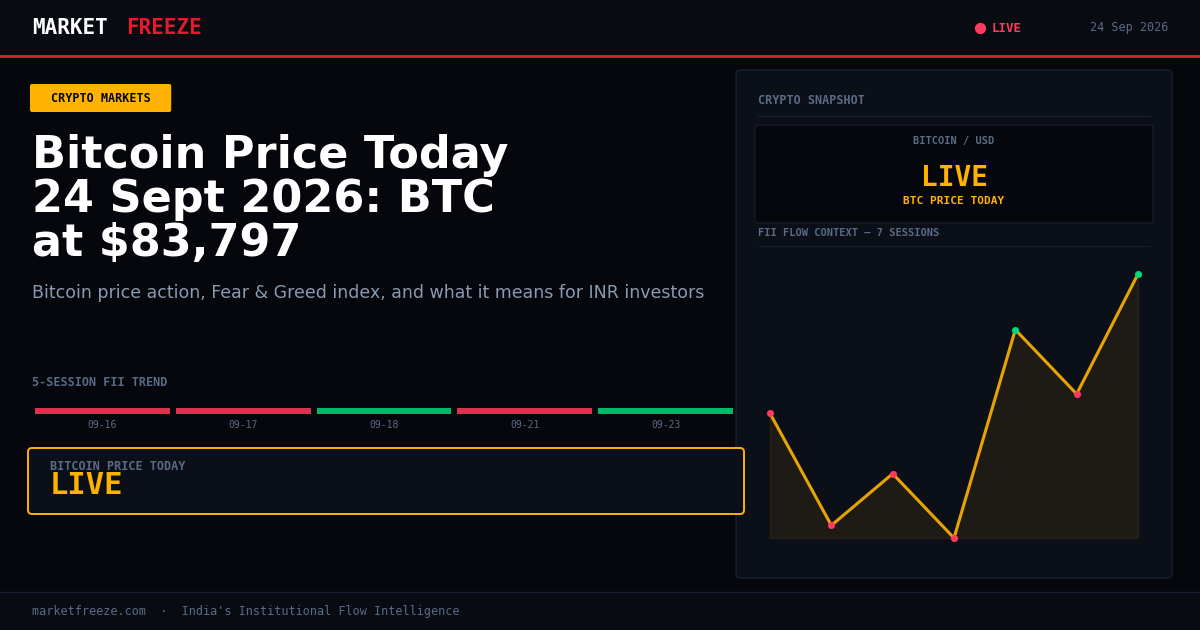
Bitcoin is currently trading at $83,473 USD (₹7,997,548 INR), marking a -2.33% change in the last 24 hours, as European regulators signal a heightened focus on AI and tokenization. The news from the EU, stating that their financial regulator will make AI and tokenization a supervisory priority in 2027, underscores a growing institutional and regulatory interest in the digital asset space, even as short-term price action shows caution.
Open a free demat account with
Upstox
or
Angel One
— zero brokerage on delivery trades.
European Regulatory Spotlight on Tokenization and AI Signals Institutional Momentum
The recent announcement from the European Union’s financial regulator regarding the prioritization of AI and tokenization in 2027 is a significant development that echoes the underlying trends driving institutional interest in digital assets. This forward-looking regulatory stance suggests a structured approach to integrating these technologies into the financial ecosystem. While Bitcoin has seen a -2.33% dip to $83,473 USD (₹7,997,548 INR) and Ethereum by -2.92% to $2,643 USD (₹253,225 INR) today, such regulatory clarity can pave the way for more robust institutional adoption in the medium to long term. By mapping how financial firms utilize AI and tokenization in client-facing products, European regulators are building a framework for future oversight. This proactive measure, even if several years out, provides a degree of predictability that institutional investors often seek. The ARK Venture Fund’s initiative with Securitize to tokenize venture fund stakes, including those in OpenAI and Anthropic, directly aligns with this trend, bringing private tech company exposure on-chain. This move, initially on Ethereum, highlights the growing utility of blockchain for accessing previously illiquid assets, a concept that regulators are now beginning to formally address.
USD/INR Dynamics and the Realized Gains for Indian Crypto Investors
The Indian Rupee is currently trading at ₹95.81 against the US Dollar. For Indian retail investors holding cryptocurrencies denominated in USD, the current exchange rate plays a crucial role in their realized returns. With Bitcoin at $83,473 USD (₹7,997,548 INR) and experiencing a -2.33% daily change, the INR value is also affected by the USD/INR rate. If an Indian investor were to sell their holdings today, the INR amount they receive would be based on the prevailing ₹95.81 rate. For example, a hypothetical sale of 1 BTC at $83,473 USD would yield approximately ₹7,997,548 INR. This means that even if the USD price of Bitcoin were to remain stable, fluctuations in the USD/INR rate can either amplify or diminish the INR returns for local investors. A strengthening Rupee (lower USD/INR) would reduce the INR equivalent of USD-denominated crypto assets, while a weakening Rupee (higher USD/INR) would increase it. Today’s price action, coupled with the current USD/INR level, suggests that while crypto prices are experiencing downward pressure, the exchange rate remains a significant factor in the absolute INR value of these digital assets for Indian investors.
Ethereum’s Performance and the Shifting ETH/BTC Dynamics
Ethereum has seen a decline of -2.92% in the last 24 hours, trading at $2,643 USD (₹253,225 INR). The ETH/BTC ratio currently stands at 0.0317, indicating that Bitcoin is outperforming Ethereum on a relative basis today. This divergence is noteworthy as it suggests a preference for the larger, more established cryptocurrency during this period of market recalibration. While both major cryptocurrencies are trading lower, the extent of Bitcoin’s resilience relative to Ethereum points to a potential rotation or a flight to perceived safety within the crypto asset class itself. The ETH/BTC ratio is a closely watched metric by institutional investors, as it can signal shifts in market sentiment and capital allocation between the two leading digital assets. Today’s reading suggests that while the broader crypto market is experiencing selling pressure, capital is flowing more readily towards Bitcoin, which could be attributed to its status as a perceived store of value or its shorter-term momentum.
Solana’s Institutional Push Amidst Broader Market Declines
Solana is trading at $114.53 USD (₹10,973 INR), down -1.84% over the past 24 hours. Despite this short-term price correction, the underlying narrative for Solana remains focused on institutional adoption, evidenced by the recent hiring of veterans from Binance and Polygon. Rachel Conlan, former Global CMO of Binance, and Jamal Raees from Polygon Labs have joined the Solana Foundation, signaling an intensified effort to court institutions for payments and asset tokenization on the Solana network. This strategic hiring underscores Solana’s ambition to become a key player in the tokenized finance space, aiming to attract significant institutional capital. The news of these hires, even amidst a general market downturn, highlights a longer-term strategic vision for the platform. As more real-world assets and payment systems migrate on-chain, Solana’s focus on scalability and efficiency positions it as a potential beneficiary, provided it can continue to attract developer activity and maintain network integrity.
The “Greed” Indicator and Historical Implications for Short-Term Corrections
The Crypto Fear & Greed Index currently stands at 71 out of 100, firmly in the “Greed” territory. Historically, readings above 60 have often preceded short-term corrections in the market, typically ranging from 5% to 15% within a two-to-four-week timeframe. While the current reading of 71 is high, it is not at the extreme levels seen during the peak of the 2020-2021 bull cycle, where greed readings persisted above 75 for extended periods. This suggests that while investor exuberance is present, there might still be room for further upside before a significant pullback. However, the historical context serves as a crucial warning: prolonged periods of “Greed” can lead to overvaluation and subsequent sharp price declines as profit-taking intensifies. For Indian retail investors, this indicator serves as a signal to reassess risk exposure and consider taking partial profits, especially if their holdings have seen substantial gains, aligning with the prudent approach of securing gains before potential market corrections.
FII Flows and Their Limited Impact on Today’s Crypto Capital Allocation
Today’s Foreign Institutional Investor (FII) net flow in Indian equities stands at ₹0 Cr. This neutral stance from FIIs, meaning they were neither significant net buyers nor sellers, has minimal direct impact on the capital allocation thesis between Indian equities and cryptocurrencies on this specific day. Historically, large inflows or outflows from FIIs have often correlated with shifts in market sentiment and capital movement across asset classes. However, with zero net activity, it’s difficult to draw a definitive conclusion about their risk appetite or asset preference today. In the absence of significant FII directional movement, the current crypto market downturn appears to be driven more by global crypto-specific factors and broader macroeconomic sentiment rather than a direct capital reallocation away from Indian equities by institutional foreign investors. The table below illustrates the FII and DII activity over the past five trading sessions, highlighting the fluctuating nature of institutional flows:
| Date | FII Net (Cr) | DII Net (Cr) | Nifty Close |
|---|---|---|---|
| 2026-09-16 | ₹-2,032.61 Cr | +₹3,908.23 Cr | 23,270.60 |
| 2026-09-17 | ₹-3,208.76 Cr | +₹3,617.75 Cr | 23,346.40 |
| 2026-09-18 | +₹599.54 Cr | +₹1,019.69 Cr | 23,414.30 |
| 2026-09-21 | ₹-576.20 Cr | +₹2,797.27 Cr | 23,329.00 |
| 2026-09-23 | +₹1,617.45 Cr | +₹2,341.46 Cr | 23,063.10 |
Navigating Crypto Tax Mechanics: A Hypothetical Scenario with Today’s Bitcoin Price
Understanding the tax implications of cryptocurrency transactions is crucial for Indian investors. Let’s consider a hypothetical scenario for an Indian investor who purchased Bitcoin at an earlier time and is now considering selling. Suppose an investor acquired 1 BTC when it was priced at $60,000 USD (approximately ₹570,000 INR at that time, assuming a USD/INR rate of ₹95). Today, with Bitcoin trading at $83,473 USD (₹7,997,548 INR), selling this 1 BTC would result in a capital gain. The profit in USD would be $83,473 – $60,000 = $23,473. In INR, this translates to approximately ₹7,997,548 – ₹570,000 = ₹7,427,548. Under Indian tax laws, such gains from the sale of Virtual Digital Assets (VDAs) are taxable at a flat rate of 30% plus applicable cess and surcharge. Therefore, the tax liability on this hypothetical sale would be approximately 30% of ₹7,427,548, which is roughly ₹2,228,264. It’s important for investors to maintain meticulous records of all purchase and sale transactions, including dates, prices in both USD and INR, and any associated transaction fees, to accurately calculate their tax obligations. The current market conditions, with Bitcoin at $83,473 USD (₹7,997,548 INR), present opportunities for profit, but also necessitate a clear understanding of the tax framework.
Actionable Framework for Crypto Portfolio Rebalancing
Given today’s market conditions, where Bitcoin is trading at $83,473 USD (₹7,997,548 INR) and the Fear & Greed Index is at 71 (“Greed”), Indian retail investors might consider a phased rebalancing strategy. The historical context of “Greed” readings above 60 often preceding short-term corrections suggests a cautious approach is warranted.
- Assess Portfolio Allocation: Review your current crypto portfolio’s asset allocation. If your exposure to riskier altcoins has grown significantly beyond your initial targets due to recent price appreciation, consider trimming these positions.
- Lock in Partial Gains: With Bitcoin at $83,473 USD (₹7,997,548 INR), consider selling a small percentage (e.g., 10-20%) of your Bitcoin holdings to secure some profits. This can help mitigate potential downside risk. The proceeds can be kept in stablecoins or reinvested strategically during market dips.
- Monitor ETH/BTC Ratio: The current ETH/BTC ratio of 0.0317 indicates Bitcoin’s outperformance. If this trend persists, it might be prudent to increase Bitcoin’s weight within your portfolio relative to Ethereum in the short term, or at least maintain current allocations, rather than increasing Ethereum’s exposure.
- Dollar-Cost Averaging (DCA) for Entry: If you are looking to increase your exposure to assets like Solana (currently at $114.53 USD | ₹10,973 INR) or other promising projects, consider using a DCA strategy. This involves investing a fixed amount at regular intervals, regardless of price. This approach can help average out your purchase cost and reduce the impact of short-term volatility.
- Watch for Support Levels: Keep an eye on key support levels for major cryptocurrencies. While specific levels are dynamic, a sustained breach of previously established support could signal further downside and present opportunities for tactical buying.
This framework aims to balance the pursuit of gains with prudent risk management, taking into account the current “Greed” sentiment and the historical tendency for corrections following such periods.
Key Levels to Watch
With Nifty closing at 23063.10, the recent trend in FII/DII flows provides some directional clues, albeit mixed. On September 23rd, FIIs were net buyers with ₹1,617.45 Cr and DIIs were also net buyers with ₹2,341.46 Cr, yet the Nifty closed lower. This suggests that while domestic institutions and some foreign players are actively buying, broader market pressures or selling from other participants may be at play. Historically, when both FIIs and DIIs are net buyers in significant amounts, it often precedes a bullish trend. However, today’s flat FII net of ₹0 Cr indicates a pause. Key resistance for Nifty is seen around the 23,200-23,300 zone, where previous highs were established. Support is currently being tested around the 23,000 mark. A decisive move above resistance on increased buying volume could signal a renewed upward push, while a break below 23,000 on higher volumes might indicate further consolidation or a short-term correction, especially if global risk-off sentiment prevails.
Frequently Asked Questions
Q: What did FII buy or sell on 2026-09-17?
A: On 2026-09-17, FIIs were net sellers of ₹-3,208.76 Cr in Indian equities.
Q: What did DII buy on 2026-09-18?
A: On 2026-09-18, DIIs were net buyers of +₹1,019.69 Cr in Indian equities.
Q: Is FII buying or selling in September 2026?
A: In September 2026, FII activity has been mixed, with periods of significant selling (e.g., ₹-3,208.76 Cr on 2026-09-17) interspersed with net buying days (e.g., +₹1,617.45 Cr on 2026-09-23). The overall trend for the month is not definitively bullish or bearish based on the data provided for the last five sessions alone, showing fluctuating institutional participation.
Bottom Line
Today’s crypto market sees a dip across major assets like Bitcoin ($83,473 USD | ₹7,997,548 INR) and Ethereum ($2,643 USD | ₹253,225 INR), coinciding with a “Greed” reading on the Fear & Greed Index, historically a precursor to potential short-term corrections. The European regulatory focus on tokenization and AI, alongside Solana’s institutional hiring push, highlights underlying growth narratives. For Indian investors, the USD/INR rate of ₹95.81 continues to be a key determinant of their realized returns. With FII flows being neutral today, the crypto price action appears driven by internal market dynamics rather than significant shifts from Indian equity institutions.
Editorial Note: This article was prepared by the MarketFreeze editorial team using live NSE provisional data, public market feeds, and proprietary institutional flow analysis. All price and flow figures are sourced directly from NSE, BSE, and CoinGecko as of 24 September 2026. This content is for informational purposes only and does not constitute investment advice. MarketFreeze is not SEBI-registered. Please consult a qualified financial advisor before making investment decisions. Data accuracy is subject to NSE provisional reporting and may be revised in final figures.