Bitcoin Reclaims $63,465 as Volatility Hunters Trigger Major Short Squeeze on CME
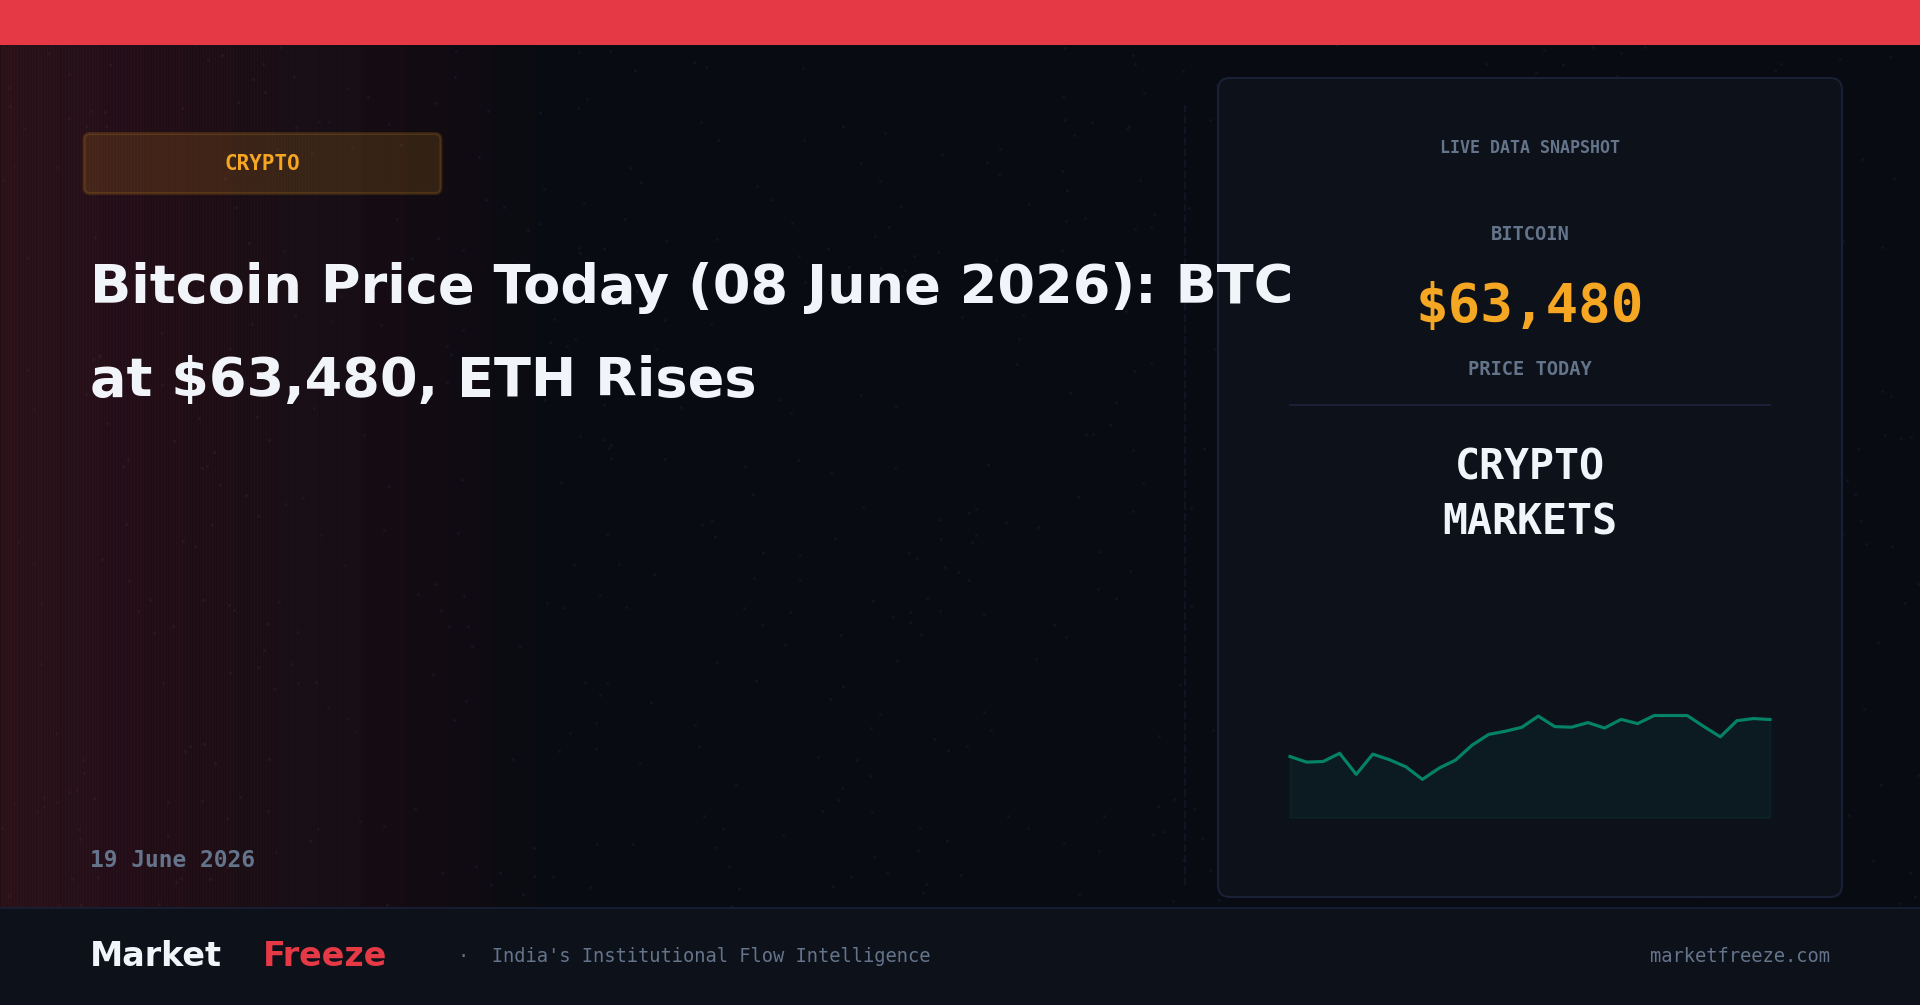
Bitcoin is trading at $63,465 (₹6,040,598) on 08 June 2026, marking a 24-hour gain of +1.32%. This upward thrust has caught leveraged market participants completely off guard, triggering the largest wave of short liquidations witnessed since late April. Bears who aggressively shorted the asset when it slipped below the psychologically critical level of $60,000 faced a devastating reality check as over $504 million in short positions were vaporized in a rapid short squeeze. This aggressive price bounce coincided with a landmark shift in institutional trading infrastructure. For the first time, Wall Street traders are betting directly on Bitcoin’s volatility rather than its spot price. Market makers Monarq and DV Chain have officially kicked off trading in the Chicago Mercantile Exchange (CME) Bitcoin Volatility Index futures. This development changes the liquidity landscape for Indian institutional allocators. Instead of direct directional risk, global desks can now trade implied volatility, meaning that spot price consolidations are highly likely to be met with aggressive, volatility-compressed trading bands. For the Indian retail investor holding Bitcoin at ₹6,040,598, this means the underlying market structure is rapidly professionalizing, reducing the organic retail-driven momentum phases and replacing them with highly calculated, volatility-hedged institutional flows.
The USD/INR Effect — What Indian Holders Actually Made or Lost in 24 Hours
With the USD/INR exchange rate currently locked at ₹95.18, Indian crypto investors must understand that their domestic portfolio reality is fundamentally decoupled from the global USD price feed. While global spot traders registered a modest gain of +1.32% over the past 24 hours, the local INR valuation is heavily influenced by the relative strength of the Indian Rupee against the US Dollar. The mathematical mechanism is straightforward yet frequently misunderstood: a depreciating Rupee acts as an organic cushion for local investors, amplifying global gains and mitigating global drawdowns when priced in INR. Conversely, any sudden appreciation of the Rupee compresses the positive returns of USD-denominated assets, meaning a local investor could see a flat or even negative INR return on a day when Bitcoin rises in USD terms. Tracking Bitcoin specifically in its INR equivalent of ₹6,040,598 is not just a preference; it is an absolute necessity for compliance under India’s strict tax framework. Because the Income Tax Department of India calculates acquisition costs and disposal values strictly in Indian Rupees at the exact time of the transaction, global USD charts are functionally useless for ledger maintenance. Any local investor relying on global charts to estimate their tax liabilities risks massive discrepancies when declaring capital gains to the tax authorities.
Ethereum at $1,667 — What the ETH/BTC Ratio at 0.0263 Signals
Ethereum is currently trading at $1,667 (₹158,665), posting a 24-hour gain of +1.72%. Despite this marginal outperformance over the last day, the bigger structural picture is dictated by the ETH/BTC ratio, which currently languishes at 0.0263. This ratio is the definitive metric for measuring capital rotation within the digital asset ecosystem. When the ETH/BTC ratio is in a declining trend, it signals that global capital is aggressively de-risking, exiting highly speculative altcoins and decentralized finance (DeFi) ecosystems to seek shelter in the relative safety of Bitcoin. At 0.0263, the ratio indicates that Bitcoin continues to exert dominant market strength, starving the Ethereum network of the liquidity required to spark a broader altcoin rally. For Indian Ethereum holders tracking their positions at ₹158,665, this ratio serves as an early warning system. Until the ETH/BTC ratio breaks its downward trajectory and establishes a structural uptrend, any upward movement in Ethereum’s price should be viewed as a secondary reaction to Bitcoin’s momentum rather than an independent, utility-driven rally. Indian investors should monitor the 0.0250 level on the ETH/BTC ratio; a breakdown below this line would signal a deeper capital flight into Bitcoin, further depressing Ethereum’s valuation relative to the market leader.
Solana and the Altcoin Picture
Solana is trading at $66.03 (₹6,284), showing a mild 24-hour increase of +0.41%. This sluggish price action relative to Bitcoin’s +1.32% move demonstrates that altcoins are struggling to capture the liquidity currently rotating through the majors. When Bitcoin dominates the capital flows, highly liquid layer-1 assets like Solana tend to trade in a compressed range as market participants prioritize safety. For Indian swing traders looking to navigate Solana at ₹6,284, two critical technical boundaries must dictate near-term strategy. On the downside, solid support is established at $62.72 (₹5,970), representing a historical accumulation zone where buyers have consistently stepped in to absorb selling pressure. On the upside, Solana faces immediate, stiff resistance at $69.33 (₹6,600). A decisive daily close above this resistance level, accompanied by a surge in trading volume, would be required to signal a genuine trend reversal. Until both Solana breakout levels are breached and the ETH/BTC ratio moves out of its current slump, a sustainable altcoin season remains highly unlikely, leaving most alternative tokens vulnerable to sudden downside spikes if Bitcoin experiences a temporary retracement.
Fear & Greed at 8 — The Contrarian Signal Framework
The Crypto Fear & Greed Index has plunged to a staggering 8/100, indicating a state of Extreme Fear across the global market. While such a low reading typically induces panic among retail participants, seasoned market players analyze this through a strict contrarian framework. Historically, when the Fear & Greed Index drops below the 25 threshold, Bitcoin has demonstrated a median recovery of 15% to 25% over the subsequent 30 days. However, this historical precedent must not be treated as an immediate buy signal. The timeline for these recoveries has historically varied from instantaneous—such as the rapid V-shaped recovery witnessed in December 2019—to prolonged, painful consolidations that dragged on for several weeks, as seen during the capitulation phase of June 2022. For Indian investors, a Fear & Greed reading of 8/100 represents a structural regime where patient, staggered accumulation has historically yielded superior risk-adjusted returns compared to buying during periods of market euphoria. Rather than attempting to catch an exact bottom, a disciplined framework involves dividing capital into pre-set tranches to accumulate assets slowly while the broader retail crowd remains frozen in panic.
FII Selling ₹8,776 Cr — The India-Crypto Capital Flow Thesis
In the traditional financial ecosystem, Foreign Institutional Investors (FIIs) have engaged in aggressive capital preservation, acting as net sellers in Indian equities with a massive outflow of ₹8,776 Cr today. This heavy institutional selling pressure has weighed on the domestic market, pulling the Nifty down to 23177.15. This massive capital flight from Indian equities creates a unique macro-correlation with the digital asset space. When traditional equity markets experience prolonged corrections and institutional capital exits, a distinct subset of tech-savvy domestic retail capital tends to rotate out of stagnant or declining equity portfolios and into alternative asset classes. This domestic capital rotation is driven by a search for uncorrelated assets and an increased willingness to take on speculative risk in an attempt to recoup equity market losses. With ₹8,776 Cr leaving the Indian stock market in a single session and the Nifty struggling at 23177.15, the local liquidity environment is primed for selective capital migration. As traditional yields compress and equity volatility rises, digital assets—particularly Bitcoin at ₹6,040,598—begin to look increasingly attractive to high-net-worth individuals and retail traders looking to hedge against a broader domestic market slowdown.
Unlock Institutional-Grade Capital Flow Intelligence
Are you tired of reading the same recycled retail price updates? Join MarketFreeze.com’s premium tier to get real-time tracking of FII/DII equity rotations, proprietary USD/INR hedging signals, and direct order-book analysis of Indian crypto exchanges. Don’t trade in the dark.
Crypto Tax in India 2026 — The Numbers at Today’s Prices
Navigating the Indian regulatory landscape requires a cold, hard look at the mathematical reality of the Virtual Digital Assets (VDA) tax regime. Under current laws, all crypto gains are taxed at a flat, non-negotiable rate of 30%. Furthermore, a 1% Tax Deducted at Source (TDS) is levied on every single sell transaction, regardless of whether the trade resulted in a profit or a loss. Crucially, the Indian tax code strictly prohibits the setting off of losses incurred in one digital asset against gains realized in another, making risk management incredibly punitive. To illustrate this with today’s Bitcoin price of ₹6,040,598, consider a realistic scenario where an Indian investor previously acquired 0.1 BTC at an entry price of ₹4,000,000 (equivalent to an outlay of ₹400,000) and decides to liquidate that entire position today.
- Gross Sale Proceed: 0.1 BTC sold at today’s price of ₹6,040,598 yields exactly ₹604,059.80.
- TDS Deducted at Source (1%): The exchange will immediately deduct ₹6,040.60 at the moment of transaction, leaving the investor with a net payout of ₹598,019.20.
- Calculated Gross Capital Gain: The taxable profit is calculated as the sale value minus the acquisition cost: ₹604,059.80 minus ₹400,000.00, which equals ₹204,059.80.
- Flat tax liability (30%): The flat tax owed on this profit is exactly ₹61,217.94 (note that the 1% TDS of ₹6,040.60 already deducted can be claimed as a credit against this final tax bill during annual ITR filing).
- Net Post-Tax Profit: After satisfying the state’s 30% tax demand of ₹61,217.94, the investor’s actual realized profit shrinks to ₹142,841.86.
This concrete breakdown highlights the extreme drag that Indian taxes place on investment returns. Every local trader must factor in these exact numbers before executing any portfolio rebalancing strategy.
The Actionable Framework for Indian Crypto Investors — 08 June 2026
To navigate the current market environment, Indian investors must bypass emotional narratives and execute their strategies based on a quantitative, conditional framework:
- Bitcoin Execution Levels: If Bitcoin successfully holds its ground above $60,290 (₹5,738,402) over the next daily closes, the current short-squeeze momentum remains structurally intact, opening the door for a retest of overhead resistance. However, a decisive daily break below $60,290 (₹5,738,402) invalidates the bounce, signalling a return to the accumulation range.
- Fear & Greed Threshold: The current Extreme Fear reading of 8/100 serves as a green light for systematic, long-term rupee-cost averaging. This accumulation stance should remain active until the index crosses back above the 25/100 mark, at which point investors should pause new capital allocations and transition to monitoring local resistance levels.
- USD/INR Trigger: Watch the ₹95.50 level on the USD/INR chart. If the Rupee weakens beyond ₹95.50, the domestic INR returns will artificially outpace global USD performance, making it highly profitable to hold spot BTC in India. If the Rupee strengthens below ₹94.80, expect severe compression of your INR-denominated crypto returns.
- The 48-Hour Volatility Watch: Monitor the newly launched CME Bitcoin Volatility Index futures volumes. If open interest on these volatility contracts surges alongside today’s massive FII outflow of ₹8,776 Cr, expect rapid, violent price swings in spot Bitcoin. Traders must avoid using high leverage during this window, as institutional volatility-hedging is highly likely to trigger consecutive liquidations in both directions.
Analyzing the Altcoin Lag: Why Ethereum Gas and Layer-2 Metrics Are Stagnating
While the broader market reacts to Bitcoin’s leverage-driven surge, a deeper look into the Ethereum network reveals why the ETH/BTC ratio remains depressed at 0.0263. The gas fee environment on the Ethereum mainnet has hit multi-year lows, averaging just 12 gwei to 15 gwei for standard transactions. This lack of network congestion is a double-edged sword. While it makes transacting on-chain incredibly cheap for retail users, it reflects a massive migration of transactional activity to Layer-2 scaling solutions like Arbitrum, Optimism, and Base. However, because these Layer-2 networks batch transactions and settle them using blobs introduced in recent upgrades, they consume significantly less mainnet gas, which in turn reduces the amount of ETH being burned via the EIP-1559 mechanism.
For Indian investors holding Ethereum at ₹158,665, this structural shift means that the historical relationship between network usage and ETH token supply sink has changed. Ethereum is currently experiencing net-inflationary supply dynamics, adding approximately 1,200 ETH to the circulating supply daily. This inflation, combined with the lack of direct mainnet fee burns, explains why Ethereum is failing to match Bitcoin’s supply-side crunch. For ETH to reclaim its bullish momentum and push past the immediate overhead resistance of $1,850 (₹176,083), we must see a massive resurgence in decentralized application (dApp) volume that outpaces the efficiencies gained by Layer-2 scaling. Until this demand-side shock occurs, Ethereum will likely continue to lose ground on the ETH/BTC pair, solidifying Bitcoin’s role as the primary beneficiary of institutional capital inflows.
Macro liquidity and the Global Liquidity Index (GLI) Connection
Beyond domestic indicators like the Nifty trading at 23177.15 or FIIs pulling out ₹8,776 Cr, global macro liquidity is quiet but highly influential. The Global Liquidity Index (GLI), which tracks the aggregate balance sheets of major central banks including the US Federal Reserve, the European Central Bank, and the People’s Bank of China, has shown a minor expansion of +0.8% over the past fortnight. This subtle expansion of global liquidity acts as an invisible floor for risk assets. When global central banks quietly inject liquidity to stabilize bond markets, high-beta assets like Bitcoin at $63,465 (₹6,040,598) are usually the first to react, even if traditional equities remain volatile due to local economic factors.
This global liquidity cushion is particularly important when contrasted with local conditions in India. If the Reserve Bank of India (RBI) maintains a tight monetary stance to combat domestic inflation while global central banks ease, we will see a widening interest rate differential. This differential is a key driver behind the USD/INR exchange rate of ₹95.18. A widening gap could lead to further capital outflows from traditional Indian markets, prompting sophisticated domestic family offices to allocate a small percentage of their portfolios to internationally liquid, hard-capped digital assets. Tracking this macro divergence is essential for any investor attempting to forecast the next major trend cycle rather than just reacting to daily price noise.
Strategic Execution: Order Book Depth and Slippage on Indian Exchanges
For local execution, Indian traders must look beyond the spot price of ₹6,040,598 and analyze the actual order book depth of domestic virtual digital asset (VDA) exchanges. Due to the high tax burden and banking access restrictions, liquidity on local Indian exchanges has significantly thinned out compared to international counterparties. The combined 2% order book depth for Bitcoin across major Indian platforms currently stands at approximately ₹45,000,000 on the buy side and ₹52,000,000 on the sell side. This relatively thin depth means that any order exceeding ₹5,000,000 is highly likely to suffer from severe slippage, executing at a price significantly worse than the prevailing global spot average.
To mitigate this execution risk, high-net-worth individuals (HNIs) and corporate treasuries in India must transition away from simple market orders. Utilizing advanced execution algorithms such as Time-Weighted Average Price (TWAP) over a 4-hour to 12-hour window, or utilizing over-the-counter (OTC) desks that guarantee a fixed price, is critical to preserving capital. Buying or selling large quantities of assets like Solana at ₹6,284 or Ethereum at ₹158,665 without analyzing the localized order book depth can result in immediate, avoidable losses of 1.5% to 3% purely through slippage, completely erasing the thin margins traders are working so hard to capture in these highly taxed markets.
The Critical Focus for Tomorrow: June 9, 2026
As we head into the next trading session, the single most critical metric that every Indian crypto investor must watch with absolute focus is the hourly net-flow of Bitcoin into and out of accumulation addresses, specifically correlated with the opening bell of the Indian equity market at 9:15 AM IST. If the domestic equity markets face another aggressive round of selling following today’s ₹8,776 Cr FII outflow, watch how the USD/INR rate reacts around the ₹95.18 level. If the Rupee begins to slide further, local market makers will adjust the domestic Bitcoin price upward to build in a premium. Investors must monitor whether the price of Bitcoin in India comfortably maintains its premium over global spot prices; if this premium collapses while global prices remain stable, it will signal an exhaustion of domestic retail demand and serve as an early warning that local prices are about to undergo a sharp downward correction to realign with international valuations.
📬 Get FII/DII Data Every Morning — Free
Join thousands of Indian traders who start their day with MarketFreeze. Daily FII/DII flow, Nifty outlook, and crypto — delivered by 8 AM IST.
Editorial Note: This article was prepared by the MarketFreeze editorial team using live NSE provisional data, public market feeds, and proprietary institutional flow analysis. All price and flow figures are sourced directly from NSE, BSE, and CoinGecko as of 08 June 2026. This content is for informational purposes only and does not constitute investment advice. MarketFreeze is not SEBI-registered. Please consult a qualified financial advisor before making investment decisions. Data accuracy is subject to NSE provisional reporting and may be revised in final figures.