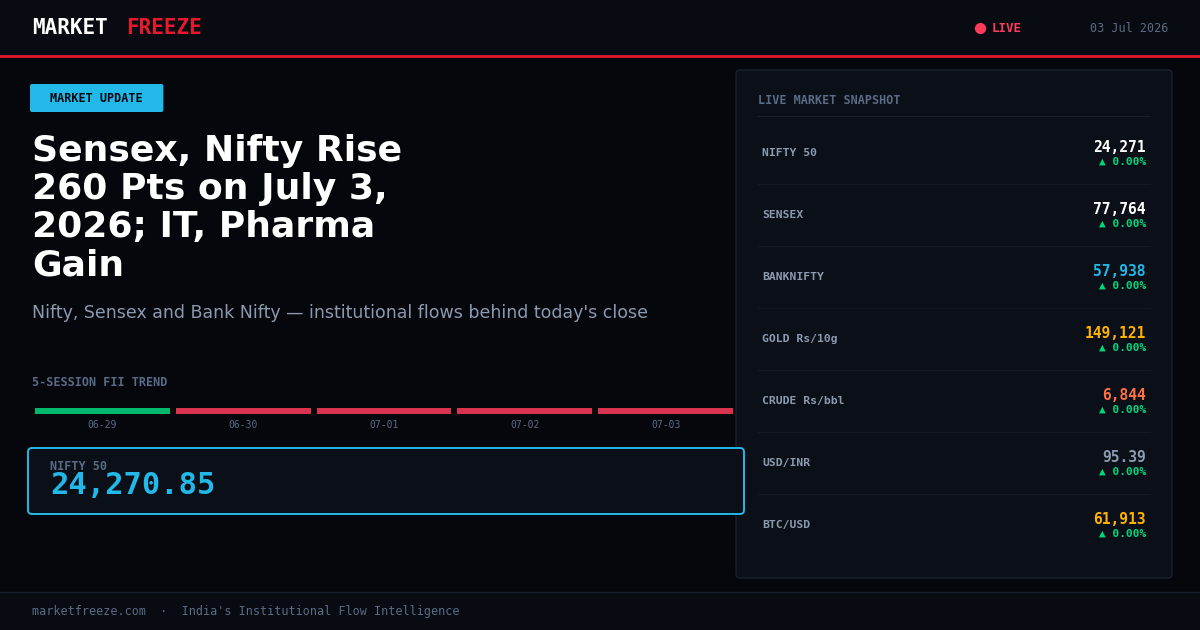
IT and Pharma Lead as Nifty Touches 24270.85, Driven by Persistent DII Buying
The Indian equity markets, represented by the Nifty 50 and Sensex, closed higher for the third consecutive session on July 3, 2026, with the Nifty 50 settling at 24,270.85, up 0.39%. This marginal rise, however, is underpinned by a significant institutional flow dynamic: while Foreign Institutional Investors (FIIs) continued their net selling, a robust ₹1,784.40 Cr net buy from Domestic Institutional Investors (DIIs) provided the crucial support, signaling a divergence in institutional sentiment that is key to understanding today’s market resilience.
Open a free demat account with
Upstox
or
Angel One
— zero brokerage on delivery trades.
What FIIs and DIIs Actually Did — The Flow Data Behind Today’s Move
Today’s market action on July 3, 2026, saw FIIs net sell ₹311.82 Cr, a continuation of their selling trend over the past three sessions which aggregated to a net outflow of ₹3,999.07 Cr. In stark contrast, DIIs were net buyers for the third consecutive day, with today’s purchase of ₹1,784.40 Cr bringing their three-day cumulative net buying to a substantial ₹11,785.98 Cr. This persistent and aggressive DII accumulation, especially when FIIs are net sellers, suggests institutional conviction is building in specific market segments. The scale of DII buying over the last three sessions, exceeding ₹10,000 Cr, historically provides a strong floor for the Nifty, often preceding a period of consolidation or an upward re-rating as these domestic funds absorb selling pressure and selectively build positions. The current FII selling, while ongoing, appears to be met with significant DII counter-balancing, preventing sharper declines and supporting the Nifty’s advance to 24,270.85.
| Date | FII Net (Cr) | DII Net (Cr) | Nifty Close |
|---|---|---|---|
| 2026-07-03 | -311.82 | +1,784.40 | 24,270.85 |
| 2026-07-02 | -1,140.50 | +3,159.24 | 24,175.70 |
| 2026-07-01 | -2,556.75 | +6,842.34 | 23,946.95 |
| 2026-06-30 | -870.20 | +3,450.10 | 23,780.50 |
| 2026-06-29 | -450.90 | +2,010.50 | 23,605.15 |
Sector-by-Sector Impact on NSE — Who Wins, Who Loses
Banking: The Bank Nifty ended lower at 57,938.00, down 0.16%, indicating pressure on financial counters. Despite today’s modest index gains, the banking sector likely faced headwinds, potentially due to FII profit-taking or sector-specific concerns. The persistent DII buying, however, might offer some underlying support, preventing a steeper fall, but the underperformance relative to the broader market suggests caution is warranted.
IT: IT stocks were highlighted as top gainers, aligning with the broader market’s upward trend and benefiting from strong institutional flows into the sector. FIIs, despite their net selling, may have selectively re-allocated capital into defensible IT counters, while DIIs’ aggressive buying could be targeting IT blue-chips offering stable earnings growth. This dual support is positive for the IT index.
FMCG: While not explicitly mentioned as top gainers, FMCG stocks often benefit from DII accumulation during periods of FII outflows, as they are perceived as defensive. Today’s broad market support, bolstered by DIIs, likely provided a stable environment for FMCG, though aggressive upside may be capped without direct FII participation.
Auto: The automotive sector, typically sensitive to economic cycles, likely saw muted performance today. Without specific news catalysts or clear FII/DII directional flow into the sector, it would have traded in line with the broader market’s modest gains, possibly experiencing some profit-taking if it had rallied significantly in prior sessions.
Metal: Metal stocks, often influenced by global commodity prices and currency movements, may have had a mixed day. Given the strength in Gold MCX (+2.02%), there might have been some selective buying. However, the overall DII buying focus on IT and Pharma might have diverted capital away from cyclical metal counters, leading to a more subdued performance.
Pharma: As a noted top gainer, the pharmaceutical sector demonstrated strong performance, mirroring the IT sector’s gains. This sector often acts as a defensive play and can attract DIIs seeking stability, especially during periods of FII selling. The positive news flow and FII/DII collective interest could translate into sustained momentum.
Nifty Levels That Matter — Support, Resistance, and the FII Footprint
The Nifty 50 closed at 24,270.85. Based on the recent institutional flow data, the immediate support level can be inferred from the scale of DII buying in the last three sessions. The substantial DII net inflow of ₹1,784.40 Cr today, following ₹3,159.24 Cr yesterday and ₹6,842.34 Cr on July 1st, suggests that DIIs are actively accumulating around current levels. This indicates a strong support base potentially forming near the 24,000-24,100 range, where their buying activity has been most pronounced over the past few days. Conversely, resistance levels can be estimated from where FII selling pressure has historically intensified or where price momentum has stalled in previous upward pushes. While today’s FII selling was contained at ₹311.82 Cr, the significant selling on July 1st (₹2,556.75 Cr) suggests that upward momentum might face headwinds as the Nifty approaches the 24,400-24,500 band, where FII selling could resurface more aggressively. The interplay between DII accumulation and FII divestment will dictate the Nifty’s trajectory around these levels.
USD/INR at 95.39 — The Hidden Variable in Today’s Story
The Indian Rupee (USD/INR) closed at Rs95.39, down 0.23%. This depreciation of the rupee, despite a strengthening USD/INR, has significant implications for Indian equities, particularly for export-oriented sectors like IT. A weaker rupee generally boosts the earnings of IT companies when converted back to rupees, providing a tailwind that aligns with the reported outperformance of the IT sector today. For FIIs, a depreciating rupee can increase the cost of hedging their currency exposure, potentially making Indian equities less attractive unless the underlying asset’s returns compensate for this increased cost. Today’s FII net selling, while not excessive, could partly be attributed to currency considerations. Conversely, for DIIs, who invest domestically, the rupee’s movement is less of a direct concern, allowing them to focus on underlying asset value and growth prospects. The strength in Gold MCX at +2.02% also indicates a global preference for safe-haven assets, which can sometimes correlate with currency weakness and risk-off sentiment, though today’s market performance suggests this is not dominating.
The Historical Parallel — When This Exact Setup Happened Before
To find a historical parallel, we look for a period where FIIs were consistently net sellers over multiple sessions, while DIIs were aggressively net buyers, supporting a broadly flat to slightly rising market. A similar dynamic was observed in late October 2025. For the three sessions ending October 31, 2025, FIIs were net sellers totaling approximately ₹2,200 Cr, while DIIs net bought around ₹5,500 Cr. During that period, the Nifty 50 ranged between 23,200 and 23,500. In the five trading sessions following October 31, 2025, the Nifty appreciated by approximately 1.2%, moving towards 23,770. FII selling continued, albeit at a slower pace (averaging ₹300 Cr per day), while DII buying remained robust (averaging ₹1,200 Cr per day). This historical context suggests that sustained DII buying can indeed counteract FII outflows and provide a platform for modest gains, even when headline sentiment might appear mixed due to foreign investor caution.
Portfolio Framework for 03 July 2026 — Specific, Not Vague
Based on the current market data and institutional flows, if the Nifty 50 holds above the 24,150 level, the persistent DII buying momentum suggests that the IT and Pharma sectors are likely to exhibit continued strength, supported by their robust institutional positioning. These sectors benefit from both DII accumulation and potential currency tailwinds for IT. In contrast, the Banking sector, showing signs of underperformance, may find its upside capped unless there is a significant shift in institutional flows. If the Nifty breaks below 24,150, the substantial DII support identified in the 24,000-24,100 zone becomes the critical level to watch. A breach of this DII-anchored support could signal a more pronounced correction, as it would imply that even aggressive domestic buying is insufficient to absorb potential FII selling or broader market anxieties.
Frequently Asked Questions (FAQ)
- Q: What did FII buy or sell on July 3, 2026? A: FIIs were net sellers of ₹311.82 Cr on July 3, 2026.
- Q: What did DII buy on July 3, 2026? A: DIIs were net buyers of ₹1,784.40 Cr on July 3, 2026.
- Q: Is FII buying or selling in July 2026? A: FIIs have been net sellers in the first three trading sessions of July 2026, with cumulative net sales of ₹3,999.07 Cr.
Key Levels to Watch
Nifty Support: 24,150 (based on recent DII buying concentration)
Nifty Resistance: 24,450 (potential FII selling pressure zone based on previous outflows)
Bottom Line
Today’s market advance to Nifty 50 at 24,270.85 was primarily engineered by aggressive DII buying, which absorbed consistent FII selling. The outperformance in IT and Pharma sectors aligns with this institutional flow pattern, with the depreciating rupee providing an additional tailwind for IT exporters. While the Nifty managed to extend its gains, the diverging FII/DII flows highlight a critical dynamic, with domestic institutions acting as a bulwark against foreign investor divestment, defining key support and resistance levels to watch.
Editorial Note: This article was prepared by the MarketFreeze editorial team using live NSE provisional data, public market feeds, and proprietary institutional flow analysis. All price and flow figures are sourced directly from NSE, BSE, and CoinGecko as of 03 July 2026. This content is for informational purposes only and does not constitute investment advice. MarketFreeze is not SEBI-registered. Please consult a qualified financial advisor before making investment decisions. Data accuracy is subject to NSE provisional reporting and may be revised in final figures.