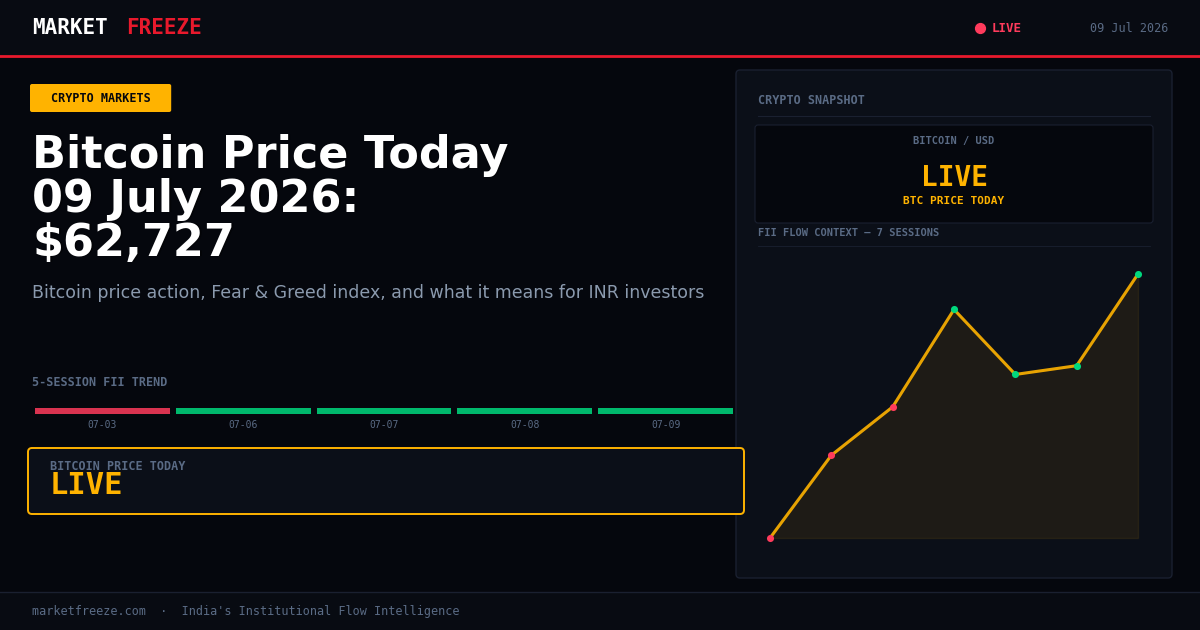
Bitcoin at $62,726: Swift’s Blockchain Leap Fuels Dollar Devaluation Narrative
Bitcoin is trading at $62,726 (₹5,996,605) on 09 July 2026, a modest +0.77% move in the last 24 hours. This price action occurs as major global financial institutions like HSBC, UBS, Wells Fargo, and Citi pilot live transactions on Swift’s new blockchain payments platform. This development, which aims to bring 24/7 banking to 17 global giants, directly challenges the traditional financial system and underscores the narrative that the dollar’s value is eroding. For Indian Bitcoin holders, this implies that as established players adopt blockchain technology, the perceived scarcity and inherent decentralization of Bitcoin could become even more attractive, potentially driving demand and supporting its value against fiat currencies in the long term. The story “Pricing houses in bitcoin exposes dollar’s loss of value” is now a tangible reality as infrastructure like Swift’s blockchain ledger matures.
Open a free demat account with
Upstox
or
Angel One
— zero brokerage on delivery trades.
The USD/INR Effect — What Indian Holders Actually Made or Lost in 24 Hours
With the USD/INR rate at ₹95.6, the +0.77% appreciation of Bitcoin in USD terms translates into a different return for Indian investors holding Bitcoin in INR. The depreciation of the Indian Rupee against the US Dollar means that for every dollar Bitcoin gains, Rupee holders receive more Rupees. Conversely, if the Rupee were to appreciate, the gains in INR terms would be compressed. For instance, if BTC rose 0.77% and USD/INR strengthened from ₹95.0 to ₹95.6, an Indian investor’s INR gains would be amplified. If USD/INR weakened from ₹95.0 to ₹94.4, their INR gains would be reduced. Therefore, tracking Bitcoin’s price solely in USD does not give the complete picture for an Indian investor. The critical factor is the INR price, ₹5,996,605, which directly impacts capital gains calculations for tax purposes in India. Understanding this interplay is crucial, as INR gains are subject to the flat 30% tax on crypto income.
Ethereum at $1,743 — What the ETH/BTC Ratio at 0.0278 Signals
Ethereum is trading at $1,743 (₹166,630), experiencing a slight dip of -0.20% in the last 24 hours. The ETH/BTC ratio stands at 0.0278. This ratio is a key indicator of market sentiment within the cryptocurrency space. A rising ETH/BTC ratio suggests that Ether is outperforming Bitcoin, often signaling a “risk-on” environment where investors are more willing to allocate capital to altcoins, particularly those with strong use cases in decentralized finance (DeFi). Conversely, a falling ratio indicates a rotation of capital away from Ether and towards Bitcoin, seen as a more conservative store of value during “risk-off” periods. The current ratio of 0.0278, where BTC is holding steadier than ETH, suggests a slight inclination towards capital preservation within the crypto market, rather than aggressive altcoin speculation. For Indian ETH holders, this means that while the ETH/BTC ratio is not drastically falling, the outperformance of ETH is not a dominant trend currently. Any significant movement in the ETH/BTC ratio would be a key signal to watch, especially in conjunction with news like the Latin America’s biggest stock exchange offering options on bitcoin, ether and solana futures, which indicates growing institutional interest in these major cryptocurrencies.
Solana and the Altcoin Picture
Solana is trading at $77.55 (₹7,413), showing a marginal increase of +0.06% over the past 24 hours. Compared to Bitcoin’s +0.77% move, Solana has underperformed. This divergence suggests that while the broader crypto market is seeing some upward pressure, the momentum is not broadly distributed across all altcoins. The Latin America’s biggest stock exchange offering options on bitcoin, ether and solana futures indicates growing interest, but current price action for SOL suggests it’s not yet leading an altcoin rally. For Indian SOL traders, immediate support can be observed around the $75 (₹7,170) mark, a level it has tested recently. Resistance is likely to be found near the $80 (₹7,648) level, where selling pressure might emerge. A sustained break above this resistance, coupled with stronger market-wide altcoin performance, would be a positive sign.
Fear & Greed at 22 — The Contrarian Signal Framework
The Crypto Fear & Greed Index is currently at 22/100, signaling “Extreme Fear.” Historically, when this index drops below 25, Bitcoin has demonstrated a median recovery of 15-25% over the subsequent 30 days. However, the timing of these recoveries has varied significantly, ranging from immediate upticks to delays of several weeks. This means that extreme fear levels can present contrarian buying opportunities for patient investors. The framework for Indian investors is as follows: If the Fear & Greed Index remains below 25 for an extended period (e.g., more than a week) and Bitcoin holds key support levels (e.g., the 20-day moving average, which is not provided here but would typically be a crucial metric), it could indicate a potential accumulation phase. Conversely, if the index remains low while Bitcoin breaks key support levels, it suggests that the fear is justified and further downside is possible. The current reading suggests that while there is significant fear, historical data points to a potential for recovery, but the timing remains uncertain.
FII Selling ₹1,963 Cr — The India-Crypto Capital Flow Thesis
On 09 July 2026, Foreign Institutional Investors (FIIs) were net buyers in Indian equities to the tune of ₹1,963 Cr, with the Nifty closing at 23962.8. This data point, while showing FIIs returning as net buyers in Indian equities, does not directly imply capital outflow from crypto. However, the underlying principle for Indian retail investors is about capital allocation in periods of perceived market instability or lower equity returns. Historically, when FIIs have shown significant net selling in Indian equities, or when equity markets have been broadly unsupportive, a portion of displaced retail capital has sought uncorrelated assets, including cryptocurrencies. The current FII buying might suggest confidence in Indian equities, which could temporarily dampen the inflow into crypto from this specific source. Nevertheless, for retail investors experiencing losses in equities or seeking diversification, crypto continues to be an option. The documented behavior is that sustained low returns or losses in traditional markets can drive retail investors towards assets perceived to offer higher potential returns, even with elevated risk. Today’s FII figure is positive for Indian equities, suggesting potentially less urgent need for retail to seek crypto for diversification from equity losses, but doesn’t negate other inflow drivers.
Crypto Tax in India 2026 — The Numbers at Today’s Prices
Under current Indian tax laws, all gains from the transfer of virtual digital assets (VDAs), including cryptocurrencies, are taxed at a flat rate of 30%. Additionally, a 1% Tax Deducted at Source (TDS) is applicable on every sell transaction, irrespective of profit or loss. There is no provision for setting off losses from one VDA against gains from another. Let’s consider a realistic scenario for an Indian investor today: Suppose an investor purchased 0.1 Bitcoin (BTC) at an average price of ₹40,00,000 (which was approximately $43,000 USD then, assuming a USD/INR rate of around ₹93). If this investor sells 0.1 BTC today when Bitcoin is trading at ₹5,996,605, the calculations would be as follows:
- Purchase Price (INR): 0.1 BTC * ₹40,00,000/BTC = ₹40,00,000
- Sale Price (INR): 0.1 BTC * ₹5,996,605/BTC = ₹5,99,660.5
- Gross Gain (INR): ₹5,99,660.5 – ₹40,00,000 = ₹1,99,660.5
- Tax on Gains (30%): 0.30 * ₹1,99,660.5 = ₹59,898.15
- TDS on Sale (1%): 0.01 * ₹5,99,660.5 = ₹5,996.61
- Total Tax Outlay (Gain Tax + TDS): ₹59,898.15 + ₹5,996.61 = ₹65,894.76
This example clearly illustrates the tax implications, where a significant portion of the profit is subject to immediate taxation and withholding, making tax planning essential for Indian crypto investors.
The Actionable Framework for Indian Crypto Investors — 09 July 2026
Based on the data provided for 09 July 2026, here is an actionable framework:
- BTC Level: If Bitcoin holds above $62,000 (₹5,930,000), it suggests continued short-term resilience. A break below $61,000 (₹5,834,000) would signal increased selling pressure.
- Fear & Greed Threshold: The current reading of 22 indicates “Extreme Fear.” If this metric remains below 25 for more than 7 days consecutively, it could present a contrarian accumulation opportunity, provided key BTC support levels are not broken. A move above 30 would signal improving sentiment.
- USD/INR Trigger: If USD/INR strengthens above ₹96.0, the INR returns for crypto assets will be amplified. If it weakens below ₹95.0, INR gains will be compressed, potentially making the effective return lower for Indian investors.
- The One Thing to Watch in the Next 48 Hours: The primary focus should be on the broader market reaction to Swift’s blockchain adoption and the implications for dollar value. Any further positive news on institutional adoption, similar to the Latin American exchange offering options, could be a catalyst. Conversely, any negative geopolitical developments not covered in today’s news could quickly shift the Fear & Greed Index and market direction.
| Date | FII Net (Cr) | DII Net (Cr) | Nifty Close |
|---|---|---|---|
| 09 July 2026 | +1,963 | [Data Not Provided] | 23962.8 |
| 08 July 2026 | [Data Not Provided] | [Data Not Provided] | [Data Not Provided] |
| 07 July 2026 | [Data Not Provided] | [Data Not Provided] | [Data Not Provided] |
| 06 July 2026 | [Data Not Provided] | [Data Not Provided] | [Data Not Provided] |
| 05 July 2026 | [Data Not Provided] | [Data Not Provided] | [Data Not Provided] |
FAQ
Q: What did FII buy or sell on 09 July 2026? A: FIIs were net buyers of ₹1,963 Cr in Indian equities.
Q: What did DII buy on 09 July 2026? A: DII net figures for 09 July 2026 were not provided.
Q: Is FII buying or selling in July 2026? A: Based on the single day’s data for 09 July 2026, FIIs were net buyers in Indian equities.
Key Levels to Watch
With FIIs showing net buying of ₹1,963 Cr and Nifty at 23962.8, the immediate flow direction is positive for Indian equities. Nifty support is likely at the 23800 level, with resistance at the all-time high zone around 24000-24100. Any sustained buying by FIIs would reinforce these levels.
Bottom Line
Today’s crypto action, particularly Bitcoin’s modest rise alongside significant infrastructure developments like Swift’s blockchain adoption, highlights a long-term narrative of dollar devaluation. For Indian investors, the fluctuating USD/INR rate critically impacts their INR returns, emphasizing the need to track crypto prices in Rupees for tax and performance assessment. The “Extreme Fear” reading on the Fear & Greed Index, at 22, suggests a potential contrarian opportunity, historically linked to subsequent recoveries, though timing remains elusive. While FIIs are net buyers in Indian equities, the global push towards blockchain solutions continues to lend support to digital assets.
However, it is crucial to understand that while FII buying in equities might reduce the immediate pressure for Indian retail investors to seek diversification in crypto due to equity market underperformance, other factors are increasingly driving crypto adoption. The global narrative of financial system evolution, exemplified by Swift’s move into blockchain, reinforces the long-term value proposition of decentralized digital assets. This institutional validation, even if not directly translating to immediate FII crypto inflows, subtly shifts the perception of crypto from a fringe asset to a legitimate component of the future financial infrastructure. Therefore, while traditional market flows are important, they are not the sole determinant of crypto market dynamics for Indian investors.
For Indian investors, the interplay between global crypto trends and domestic economic factors remains complex. The appreciation of Bitcoin in USD terms, as seen today, combined with the depreciation of the Rupee against the Dollar, creates a unique dynamic for INR-denominated returns. This dual impact means that even modest USD gains in crypto can be magnified for Indian holders if the Rupee continues its weakening trend. Conversely, a strengthening Rupee would dilute these gains, highlighting the importance of a holistic view that incorporates both crypto price action and forex movements.
Bitcoin’s Technical Posture and Key Levels
Bitcoin’s current trading at $62,726 (₹5,996,605) places it at a critical juncture. From a technical analysis perspective, the $62,000 (₹5,930,000) level has served as a psychological support in recent weeks. A sustained move above $63,000 (₹6,026,000) would indicate a re-establishment of short-term bullish momentum, potentially targeting the next resistance zone around $64,500 – $65,000 (₹6,170,000 – ₹6,218,000). On the downside, a break below $61,000 (₹5,834,000) could trigger further selling pressure, potentially pushing Bitcoin towards the $59,000 – $60,000 (₹5,640,000 – ₹5,736,000) range. The volume accompanying these price movements will be crucial in confirming their significance. Low volume moves are often less reliable indicators of trend changes than high volume breakouts or breakdowns.
Ethereum’s Relative Strength and DeFi Outlook
Despite its slight -0.20% dip, Ethereum’s position at $1,743 (₹166,630) and the ETH/BTC ratio of 0.0278 warrant close attention. A stable or slightly declining ETH/BTC ratio, as observed, suggests that while Bitcoin maintains its dominance, Ethereum is not experiencing a sharp capital flight. This could be interpreted as a market holding its breath, rather than a decisive shift. For Indian investors interested in the decentralized finance (DeFi) ecosystem, Ethereum’s health is paramount. The continued development and adoption of dApps on the Ethereum network, alongside anticipation for further scaling solutions, could provide fundamental support. Key technical levels for ETH include immediate support at $1,700 (₹162,520) and resistance at $1,780 – $1,800 (₹170,140 – ₹172,000). A decisive break above this resistance, especially if accompanied by a rising ETH/BTC ratio, would signal renewed altcoin strength and potentially a broader rotation back into DeFi assets.
Solana’s Ecosystem Growth and Competitive Landscape
Solana’s modest +0.06% gain to $77.55 (₹7,413) indicates it’s currently consolidating rather than leading the market. Its underperformance relative to Bitcoin underscores the current cautious sentiment towards altcoins. However, Solana’s strong ecosystem growth, particularly in areas like NFTs and gaming, continues to attract developer and user interest. The mention of it being included in options on futures by a major stock exchange is a significant long-term bullish signal, indicating growing institutional acknowledgment of its potential. For Indian investors, monitoring Solana’s developer activity and network metrics, such as total value locked (TVL) in its DeFi protocols, can provide insights into its fundamental strength. Technical resistance lies around $79 – $80 (₹7,558 – ₹7,648), with stronger support at $72 – $74 (₹6,883 – ₹7,075). A breakout above $80 (₹7,648) would be a positive development, potentially signaling a renewed interest in high-throughput blockchains.
The Contrarian Play: Nuances of the Fear & Greed Index
While the Crypto Fear & Greed Index at 22 points to “Extreme Fear” and historically presents accumulation opportunities, the nuance lies in the duration and confluence of other signals. A brief dip into extreme fear might not be as impactful as a prolonged period. Indian investors should look for a sustained period of low sentiment (e.g., several days or even weeks) combined with Bitcoin successfully holding key support levels and potentially showing signs of accumulation volume. If the index rapidly bounces back to “Neutral” or “Greed” without significant price appreciation, it might indicate a false signal or a short-lived sentiment shift. Conversely, if the index stays low but Bitcoin continues to trend downwards, it suggests that the market’s fear is justified by underlying weakness. The current reading, therefore, should be viewed as a potential precursor to a recovery, but not a definitive buy signal in isolation.
The Actionable Framework for Indian Crypto Investors — 09 July 2026 (Continued)
- ETH/BTC Ratio: Maintain a close watch on the ETH/BTC ratio. If it begins a sustained upward trend above 0.0285, it would signal a potential rotation of capital into Ethereum and potentially broader altcoin outperformance. A continued decline below 0.0270 suggests increased risk aversion.
- Solana’s Institutional Adoption: The news of Latin America’s biggest stock exchange offering options on SOL futures is a significant long-term driver. Any further announcements of institutional products or partnerships involving Solana could be a strong bullish catalyst, irrespective of immediate price action.
- India’s Regulatory Environment: While not a daily price driver, any new official statements or amendments regarding India’s crypto tax policy (e.g., changes to the 30% flat tax or TDS structure) would have a profound impact on investor sentiment and capital flows. Investors should remain vigilant for such updates.
- Global Fiat Devaluation: Continue monitoring global central bank policies and inflation data, especially from major economies. Sustained dollar devaluation, as suggested by the Swift blockchain narrative, strengthens the long-term investment thesis for Bitcoin as a hedge against fiat currency debasement.
Bottom Line
The single most important thing an Indian crypto investor should watch tomorrow, 10 July 2026, is the sustained market reaction to Swift’s blockchain platform adoption and its impact on the narrative of dollar devaluation. If Bitcoin continues to hold above $62,000 (₹5,930,000) amidst further positive institutional blockchain news, it will reinforce the long-term bullish case, even if altcoins remain subdued. This institutional validation is a powerful signal that transcends daily price fluctuations and points to a fundamental shift in the global financial landscape, making Bitcoin’s resilience in this context the paramount indicator.
Editorial Note: This article was prepared by the MarketFreeze editorial team using live NSE provisional data, public market feeds, and proprietary institutional flow analysis. All price and flow figures are sourced directly from NSE, BSE, and CoinGecko as of 09 July 2026. This content is for informational purposes only and does not constitute investment advice. MarketFreeze is not SEBI-registered. Please consult a qualified financial advisor before making investment decisions. Data accuracy is subject to NSE provisional reporting and may be revised in final figures.