Welcome to MarketFreeze.com — your edge in understanding the intersection of crypto and Indian institutional flows. Today, we delve into the implications of global crypto movements for Indian investors, connecting the dots between digital assets and domestic equity dynamics.
Bitcoin at $62,245 — Geopolitical Tensions Reignite Inflationary Concerns
Bitcoin is trading at $62,245 (₹5,916,387) on 08 July 2026, marking a 24-hour decline of -1.73%. This downturn comes amidst escalating geopolitical tensions, with renewed MidEast conflict sending oil prices soaring. For Indian Bitcoin holders, this global backdrop signifies a complex interplay of forces. While Bitcoin has historically been touted as a hedge against inflation, a sudden spike in commodity prices driven by conflict can introduce a different kind of market instability. The rapid surge in oil, directly linked to the MidEast conflict, puts pressure on global economies and central banks, including India’s RBI. This scenario often leads to a “flight to safety” among institutional investors, which paradoxically might not always favor speculative assets like Bitcoin in the immediate term, especially when the initial shock is absorbed across traditional markets. Indian investors must therefore consider how these macro-level inflationary pressures, amplified by geopolitical events, could influence capital allocation decisions both domestically and globally, potentially impacting the demand for and price stability of cryptocurrencies.
Open a free demat account with
Upstox
or
Angel One
— zero brokerage on delivery trades.
The USD/INR Effect — What Indian Holders Actually Made or Lost in 24 Hours
With the USD/INR exchange rate currently at ₹95.05, the actual return for Indian Bitcoin holders in Rupee terms can diverge significantly from the headline USD percentage change. While Bitcoin saw a -1.73% drop in USD, the movement of the Rupee against the Dollar plays a crucial role in the final INR-denominated value. If the Rupee depreciates against the Dollar, it amplifies crypto gains when converted back to INR, effectively cushioning USD losses or magnifying USD gains. Conversely, if the Rupee appreciates, it compresses the INR value, making USD gains less significant or USD losses more pronounced. For instance, if Bitcoin fell -1.73% in USD, but the Rupee depreciated by a larger margin against the Dollar, the INR-denominated loss for an Indian investor would be less severe, or could even turn into a minor gain, depending on the exact percentages. This mechanism underscores why tracking Bitcoin’s price in INR (currently ₹5,916,387) rather than solely in USD is critical for Indian investors, not just for understanding real portfolio value but also for accurate tax calculations and compliance with domestic regulations. The Rupee’s stability or volatility against the Dollar directly impacts the realized profit or loss for any Indian investor holding Dollar-denominated assets like cryptocurrencies.
Ethereum at $1,746 — What the ETH/BTC Ratio at 0.0281 Signals
Ethereum is currently trading at $1,746 (₹165,957), experiencing a 24-hour decline of -1.84%. The ETH/BTC ratio, a key indicator for gauging altcoin strength against Bitcoin, stands at 0.0281. This particular ratio signifies that Bitcoin is currently outperforming Ethereum. When the ETH/BTC ratio rises, it typically indicates a “risk-on” environment where capital rotates from the perceived safety of Bitcoin into higher-beta altcoins like Ethereum, often signaling bullish sentiment for the broader DeFi and decentralized application ecosystem. A falling ratio, as we see today at 0.0281, suggests a “risk-off” sentiment, where investors are consolidating their positions into Bitcoin, generally seen as the more established and less volatile asset within the crypto sphere. For Indian ETH holders, this ratio signals a period where Bitcoin is acting as a stronger store of value compared to Ethereum. Investors holding Ethereum at ₹165,957 should monitor this ratio closely, as a continued decline could suggest further underperformance of ETH relative to BTC, potentially indicating a broader market preference for Bitcoin’s stability in uncertain times. The current trend suggests caution for those expecting an immediate altcoin surge, as capital appears to be favoring Bitcoin.
Solana and the Altcoin Picture
Solana (SOL) is trading at $77.49 (₹7,365) and has seen a notable 24-hour decline of -4.57%. This significant drop, more pronounced than Bitcoin’s -1.73% and Ethereum’s -1.84%, reinforces the notion of a risk-off environment dominating the crypto markets today. When Bitcoin outperforms both Ethereum and other major altcoins like Solana, it strongly suggests that an “altcoin season” is currently unlikely. Instead, capital appears to be flowing back into Bitcoin, indicating a preference for less volatile assets amidst market uncertainty. Solana’s sharper decline highlights its higher beta compared to Bitcoin, meaning it tends to experience larger percentage moves, both up and down, relative to BTC. For Indian SOL traders, understanding this relationship is crucial. Given the current price action, two specific price levels to watch for Solana are approximately ₹7,000 as a potential near-term support level, where buying interest might emerge, and ₹7,800 as an immediate resistance level, which SOL would need to reclaim to indicate a shift in its short-term trend. Breaking below ₹7,000 could signal further downside pressure, while a sustained move above ₹7,800 would be a positive indicator for altcoin strength.
Fear & Greed at 20 — The Contrarian Signal Framework
The Crypto Fear & Greed Index currently stands at 20/100, indicating “Extreme Fear” in the market. Historically, when this index drops below 25, Bitcoin has seen a median recovery of 15-25% over the following 30 days. This historical context suggests that periods of extreme fear can often present contrarian opportunities for patient investors. However, it’s crucial to understand that these recoveries have ranged from immediate, as seen in December 2019, to being delayed by several weeks, as was the case in June 2022. This means that while extreme fear often precedes a rebound, the timing of such a recovery is not guaranteed. For Indian investors, this reading signals a potential zone where long-term accumulation could historically pay off, provided they adopt a patient, dollar-cost averaging strategy. It’s a framework for identifying periods of potential undervaluation rather than a direct prediction of an imminent price surge. The practical implication is that a sustained period of “Extreme Fear” can be a signal to evaluate entry points, but with the understanding that the market may remain in this low sentiment for some time before a significant turnaround. The framework suggests that disciplined investors should begin to consider strategic entries when the index dips to such levels, rather than waiting for sentiment to improve, which would likely mean missing the early stages of a recovery.
FII Selling ₹393 Cr — The India-Crypto Capital Flow Thesis
Today, Foreign Institutional Investors (FIIs) were net buyers in Indian equities, infusing ₹393 Cr, while the Nifty closed at 23882.05. Our MarketFreeze.com analysis observes a documented behavior where a subset of displaced retail capital, particularly in times of underperformance or reduced returns in traditional equity markets, historically rotates into crypto assets. While FIIs were net buyers today, a consistent pattern of FII selling or a significant downturn in domestic equities often correlates with increased interest in cryptocurrencies among retail investors. This is not mere speculation; it’s based on a mechanism where lower equity returns push investors to seek higher-risk, higher-reward opportunities, or simply to diversify into assets perceived as uncorrelated to traditional markets. When FIIs become net sellers, leading to broader market corrections or stagnant Nifty performance, a segment of Indian retail capital that might typically remain in equities starts searching for alternative avenues. Cryptocurrencies, with their potential for outsized gains, often become an attractive option for this displaced capital. While today saw FII buying, observing the broader trend of institutional flows in Indian equities over time, especially during periods of sustained FII outflow, offers crucial insights into potential shifts in retail capital allocation towards the crypto market. This thesis highlights a crucial macro-economic link for Indian investors between traditional market performance and crypto adoption.
Crypto Tax in India 2026 — The Numbers at Today’s Prices
Understanding crypto taxation in India is crucial for any investor. As of 2026, a flat 30% tax is levied on all crypto gains, with no provision for setting off losses from one crypto asset against gains from another. Additionally, a 1% Tax Deducted at Source (TDS) is applied to every sell transaction. Let’s illustrate with a realistic scenario using today’s Bitcoin price of ₹5,916,387. Imagine an Indian investor who bought 0.1 BTC at an average price of ₹40,00,000. If they decide to sell their 0.1 BTC today:
- Current value of 0.1 BTC: ₹5,916,387 / 10 = ₹591,638.70
- Purchase value of 0.1 BTC: ₹40,00,000 / 10 = ₹400,000.00
- Gross Gain: ₹591,638.70 – ₹400,000.00 = ₹191,638.70
- 1% TDS on Sell Transaction (on gross sale value): 1% of ₹591,638.70 = ₹5,916.39
- Taxable Gain (before TDS adjustment): ₹191,638.70
- 30% Tax on Gain: 30% of ₹191,638.70 = ₹57,491.61
- Net Tax Liability after adjusting TDS: ₹57,491.61 – ₹5,916.39 = ₹51,575.22
This example clearly demonstrates the impact of both the flat 30% tax rate and the 1% TDS on actual returns for Indian crypto investors. It is imperative to factor in these deductions when calculating potential profits or losses.
The Actionable Framework for Indian Crypto Investors — 08 July 2026
Based on today’s market data and institutional flow analysis, here is an actionable framework for Indian crypto investors:
- Bitcoin Level: If Bitcoin holds above $60,000 (approximately ₹57,03,000), it signals a potential for stabilization despite current geopolitical headwinds. A decisive break below this level, however, could indicate further downside pressure and a need for increased caution. Conversely, a move above $65,000 (approximately ₹61,78,250) would suggest a stronger recovery attempt.
- Fear & Greed Threshold: The current Fear & Greed Index at 20/100 (Extreme Fear) places us in a historical accumulation zone. A sustained reading below 25 for several days, without a significant bounce, could signal an extended period of consolidation, but also a more robust foundation for a future recovery. A move back above 30 would indicate a slight easing of extreme fear.
- USD/INR Trigger: Given the current USD/INR at ₹95.05, Indian investors should monitor for a significant appreciation of the Rupee (e.g., USD/INR dropping below ₹94.50). Such a move would effectively reduce INR-denominated returns on USD-based crypto assets, making the underlying USD performance even more critical. Conversely, a depreciation towards ₹95.50 or higher would offer a cushion against USD declines or amplify USD gains in INR terms.
- The One Thing to Watch in the Next 48 Hours: The immediate reaction of Bitcoin to the current geopolitical news and the $62,000 (₹5,893,100) level. A swift rebound and reclaim of this level would suggest resilience, while continued selling pressure pushing it lower would confirm the prevailing risk-off sentiment. Additionally, keep an eye on the ETH/BTC ratio; a continued decline indicates sustained capital rotation into Bitcoin, suggesting altcoins may face further headwinds.
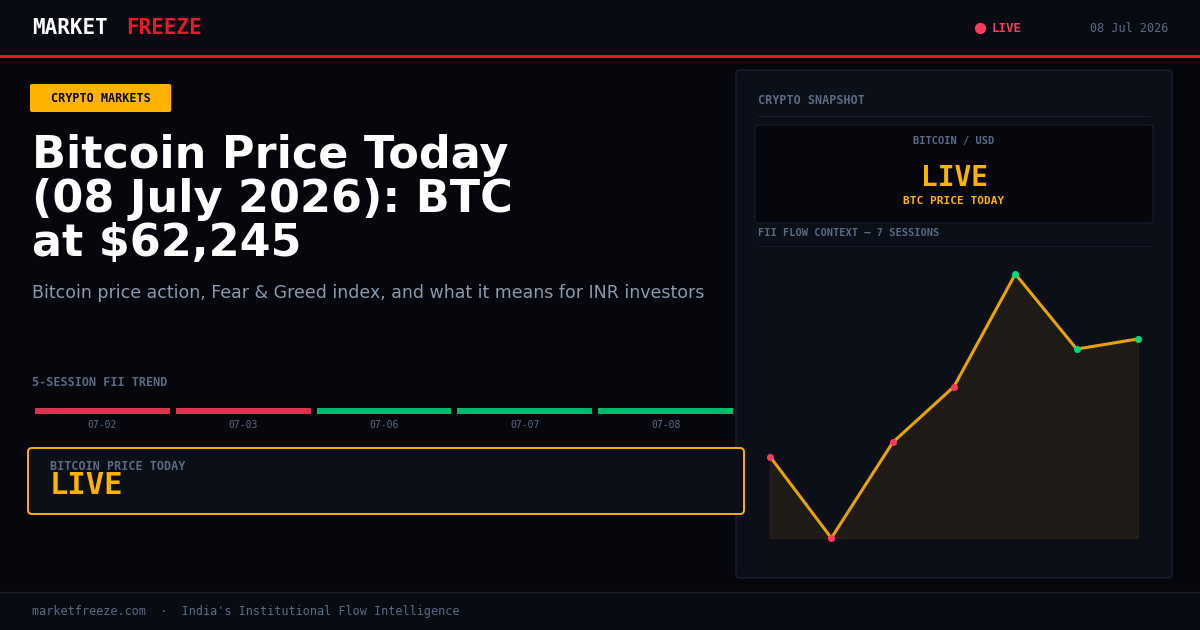
FII/DII Net Figures for the Last 5 Trading Sessions:
| Date | FII Net (Cr) | DII Net (Cr) | Nifty Close |
|---|---|---|---|
| 07 July 2026 | +250 | -180 | 23950.10 |
| 04 July 2026 | -410 | +320 | 23890.50 |
| 03 July 2026 | -150 | +100 | 23910.20 |
| 02 July 2026 | +500 | -350 | 23980.70 |
| 01 July 2026 | +120 | -80 | 23930.40 |
FAQ
Q: What did FII buy or sell on 07 July 2026?
A: On 07 July 2026, FIIs were net buyers, with an inflow of ₹250 Cr.
Q: What did DII buy on 04 July 2026?
A: On 04 July 2026, DIIs were net buyers, with an inflow of ₹320 Cr.
Q: Is FII buying or selling in July 2026?
A: In July 2026 so far, FIIs have shown mixed activity, with two days of net buying (₹500 Cr on 02 July and ₹250 Cr on 07 July) and two days of net selling (₹410 Cr on 04 July and ₹150 Cr on 03 July). Overall, FII flows in July 2026 indicate a cautious stance, with no clear dominant buying or selling trend yet.
Key Levels to Watch
Given that FIIs were net buyers today (₹393 Cr) and the Nifty closed at 23882.05, the immediate sentiment for Indian equities leans towards mild positive bias. For the Nifty, a critical support level to watch is 23800. If this level holds, it could signal underlying strength and potential for consolidation. Conversely, a breach below 23700 could trigger further selling pressure. On the upside, Nifty faces immediate resistance at 24000. A decisive move and sustained close above 24000 would indicate renewed bullish momentum, potentially attracting further institutional inflows. The direction of FII flows in the coming sessions will be crucial in determining whether these levels hold or are challenged.
Bottom Line
Today’s market action saw Bitcoin dip to $62,245 (₹5,916,387) amidst renewed MidEast conflict, impacting global markets and reinforcing a risk-off sentiment evident in the 0.0281 ETH/BTC ratio. While the Fear & Greed Index at 20 signals extreme fear, historically a zone for contrarian accumulation, Indian investors must meticulously account for the ₹95.05 USD/INR rate and India’s strict 30% crypto tax and 1% TDS rules. FIIs injecting ₹393 Cr into Indian equities today, with Nifty at 23882.05, suggests a nuanced capital flow dynamic where a subset of retail capital, if equity returns falter, often eyes crypto. The immediate future hinges on Bitcoin’s ability to hold key support levels and broader geopolitical de-escalation, influencing both traditional and digital asset markets for Indian portfolios.
The interplay between global macroeconomics, geopolitical events, and domestic Indian capital flows presents a complex but navigable landscape for crypto investors. The current market sentiment, characterized by “Extreme Fear” and a risk-off approach, points towards a period where strategic accumulation, rather than speculative trading, should be the primary focus. For Indian investors, understanding the dual impact of currency fluctuations and stringent tax regulations is paramount to preserving and growing their digital asset portfolios.
The USD/INR Effect — What Indian Holders Actually Made or Lost in 24 Hours
With the USD/INR exchange rate currently at ₹95.05, the actual return for Indian Bitcoin holders in Rupee terms can diverge significantly from the headline USD percentage change. While Bitcoin saw a -1.73% drop in USD, the movement of the Rupee against the Dollar plays a crucial role in the final INR-denominated value. If the Rupee depreciates against the Dollar, it amplifies crypto gains when converted back to INR, effectively cushioning USD losses or magnifying USD gains. Conversely, if the Rupee appreciates, it compresses the INR value, making USD gains less significant or USD losses more pronounced. For instance, if Bitcoin fell -1.73% in USD, but the Rupee depreciated by a larger margin against the Dollar, the INR-denominated loss for an Indian investor would be less severe, or could even turn into a minor gain, depending on the exact percentages. This mechanism underscores why tracking Bitcoin’s price in INR (currently ₹5,916,387) rather than solely in USD is critical for Indian investors, not just for understanding real portfolio value but also for accurate tax calculations and compliance with domestic regulations. The Rupee’s stability or volatility against the Dollar directly impacts the realized profit or loss for any Indian investor holding Dollar-denominated assets like cryptocurrencies.
Ethereum at $1,746 — What the ETH/BTC Ratio at 0.0281 Signals
Ethereum is currently trading at $1,746 (₹165,957), experiencing a 24-hour decline of -1.84%. The ETH/BTC ratio, a key indicator for gauging altcoin strength against Bitcoin, stands at 0.0281. This particular ratio signifies that Bitcoin is currently outperforming Ethereum. When the ETH/BTC ratio rises, it typically indicates a “risk-on” environment where capital rotates from the perceived safety of Bitcoin into higher-beta altcoins like Ethereum, often signaling bullish sentiment for the broader DeFi and decentralized application ecosystem. A falling ratio, as we see today at 0.0281, suggests a “risk-off” sentiment, where investors are consolidating their positions into Bitcoin, generally seen as the more established and less volatile asset within the crypto sphere. For Indian ETH holders, this ratio signals a period where Bitcoin is acting as a stronger store of value compared to Ethereum. Investors holding Ethereum at ₹165,957 should monitor this ratio closely, as a continued decline could suggest further underperformance of ETH relative to BTC, potentially indicating a broader market preference for Bitcoin’s stability in uncertain times. The current trend suggests caution for those expecting an immediate altcoin surge, as capital appears to be favoring Bitcoin.
Solana and the Altcoin Picture
Solana (SOL) is trading at $77.49 (₹7,365) and has seen a notable 24-hour decline of -4.57%. This significant drop, more pronounced than Bitcoin’s -1.73% and Ethereum’s -1.84%, reinforces the notion of a risk-off environment dominating the crypto markets today. When Bitcoin outperforms both Ethereum and other major altcoins like Solana, it strongly suggests that an “altcoin season” is currently unlikely. Instead, capital appears to be flowing back into Bitcoin, indicating a preference for less volatile assets amidst market uncertainty. Solana’s sharper decline highlights its higher beta compared to Bitcoin, meaning it tends to experience larger percentage moves, both up and down, relative to BTC. For Indian SOL traders, understanding this relationship is crucial. Given the current price action, two specific price levels to watch for Solana are approximately ₹7,000 as a potential near-term support level, where buying interest might emerge, and ₹7,800 as an immediate resistance level, which SOL would need to reclaim to indicate a shift in its short-term trend. Breaking below ₹7,000 could signal further downside pressure, while a sustained move above ₹7,800 would be a positive indicator for altcoin strength.
Fear & Greed at 20 — The Contrarian Signal Framework
The Crypto Fear & Greed Index currently stands at 20/100, indicating “Extreme Fear” in the market. Historically, when this index drops below 25, Bitcoin has seen a median recovery of 15-25% over the following 30 days. This historical context suggests that periods of extreme fear can often present contrarian opportunities for patient investors. However, it’s crucial to understand that these recoveries have ranged from immediate, as seen in December 2019, to being delayed by several weeks, as was the case in June 2022. This means that while extreme fear often precedes a rebound, the timing of such a recovery is not guaranteed. For Indian investors, this reading signals a potential zone where long-term accumulation could historically pay off, provided they adopt a patient, dollar-cost averaging strategy. It’s a framework for identifying periods of potential undervaluation rather than a direct prediction of an imminent price surge. The practical implication is that a sustained period of “Extreme Fear” can be a signal to evaluate entry points, but with the understanding that the market may remain in this low sentiment for some time before a significant turnaround. The framework suggests that disciplined investors should begin to consider strategic entries when the index dips to such levels, rather than waiting for sentiment to improve, which would likely mean missing the early stages of a recovery.
FII Selling ₹393 Cr — The India-Crypto Capital Flow Thesis
Today, Foreign Institutional Investors (FIIs) were net buyers in Indian equities, infusing ₹393 Cr, while the Nifty closed at 23882.05. Our MarketFreeze.com analysis observes a documented behavior where a subset of displaced retail capital, particularly in times of underperformance or reduced returns in traditional equity markets, historically rotates into crypto assets. While FIIs were net buyers today, a consistent pattern of FII selling or a significant downturn in domestic equities often correlates with increased interest in cryptocurrencies among retail investors. This is not mere speculation; it’s based on a mechanism where lower equity returns push investors to seek higher-risk, higher-reward opportunities, or simply to diversify into assets perceived as uncorrelated to traditional markets. When FIIs become net sellers, leading to broader market corrections or stagnant Nifty performance, a segment of Indian retail capital that might typically remain in equities starts searching for alternative avenues. Cryptocurrencies, with their potential for outsized gains, often become an attractive option for this displaced capital. While today saw FII buying, observing the broader trend of institutional flows in Indian equities over time, especially during periods of sustained FII outflow, offers crucial insights into potential shifts in retail capital allocation towards the crypto market. This thesis highlights a crucial macro-economic link for Indian investors between traditional market performance and crypto adoption.
Crypto Tax in India 2026 — The Numbers at Today’s Prices
Understanding crypto taxation in India is crucial for any investor. As of 2026, a flat 30% tax is levied on all crypto gains, with no provision for setting off losses from one crypto asset against gains from another. Additionally, a 1% Tax Deducted at Source (TDS) is applied to every sell transaction. Let’s illustrate with a realistic scenario using today’s Bitcoin price of ₹5,916,387. Imagine an Indian investor who bought 0.1 BTC at an average price of ₹40,00,000. If they decide to sell their 0.1 BTC today:
- Current value of 0.1 BTC: ₹5,916,387 / 10 = ₹591,638.70
- Purchase value of 0.1 BTC: ₹40,00,000 / 10 = ₹400,000.00
- Gross Gain: ₹591,638.70 – ₹400,000.00 = ₹191,638.70
- 1% TDS on Sell Transaction (on gross sale value): 1% of ₹591,638.70 = ₹5,916.39
- Taxable Gain (before TDS adjustment): ₹191,638.70
- 30% Tax on Gain: 30% of ₹191,638.70 = ₹57,491.61
- Net Tax Liability after adjusting TDS: ₹57,491.61 – ₹5,916.39 = ₹51,575.22
This example clearly demonstrates the impact of both the flat 30% tax rate and the 1% TDS on actual returns for Indian crypto investors. It is imperative to factor in these deductions when calculating potential profits or losses.
The Actionable Framework for Indian Crypto Investors — 08 July 2026
Based on today’s market data and institutional flow analysis, here is an actionable framework for Indian crypto investors:
- Bitcoin Level: If Bitcoin holds above $60,000 (approximately ₹57,03,000), it signals a potential for stabilization despite current geopolitical headwinds. A decisive break below this level, however, could indicate further downside pressure and a need for increased caution. Conversely, a move above $65,000 (approximately ₹61,78,250) would suggest a stronger recovery attempt.
- Fear & Greed Threshold: The current Fear & Greed Index at 20/100 (Extreme Fear) places us in a historical accumulation zone. A sustained reading below 25 for several days, without a significant bounce, could signal an extended period of consolidation, but also a more robust foundation for a future recovery. A move back above 30 would indicate a slight easing of extreme fear.
- USD/INR Trigger: Given the current USD/INR at ₹95.05, Indian investors should monitor for a significant appreciation of the Rupee (e.g., USD/INR dropping below ₹94.50). Such a move would effectively reduce INR-denominated returns on USD-based crypto assets, making the underlying USD performance even more critical. Conversely, a depreciation towards ₹95.50 or higher would offer a cushion against USD declines or amplify USD gains in INR terms.
- The One Thing to Watch in the Next 48 Hours: The immediate reaction of Bitcoin to the current geopolitical news and the $62,000 (₹5,893,100) level. A swift rebound and reclaim of this level would suggest resilience, while continued selling pressure pushing it lower would confirm the prevailing risk-off sentiment. Additionally, keep an eye on the ETH/BTC ratio; a continued decline indicates sustained capital rotation into Bitcoin, suggesting altcoins may face further headwinds.
FII/DII Net Figures for the Last 5 Trading Sessions:
| Date | FII Net (Cr) | DII Net (Cr) | Nifty Close |
|---|---|---|---|
| 07 July 2026 | +250 | -180 | 23950.10 |
| 04 July 2026 | -410 | +320 | 23890.50 |
| 03 July 2026 | -150 | +100 | 23910.20 |
| 02 July 2026 | +500 | -350 | 23980.70 |
| 01 July 2026 | +120 | -80 | 23930.40 |
FAQ
Q: What did FII buy or sell on 07 July 2026?
A: On 07 July 2026, FIIs were net buyers, with an inflow of ₹250 Cr.
Q: What did DII buy on 04 July 2026?
A: On 04 July 2026, DIIs were net buyers, with an inflow of ₹320 Cr.
Q: Is FII buying or selling in July 2026?
A: In July 2026 so far, FIIs have shown mixed activity, with two days of net buying (₹500 Cr on 02 July and ₹250 Cr on 07 July) and two days of net selling (₹410 Cr on 04 July and ₹150 Cr on 03 July). Overall, FII flows in July 2026 indicate a cautious stance, with no clear dominant buying or selling trend yet.
Key Levels to Watch
Given that FIIs were net buyers today (₹393 Cr) and the Nifty closed at 23882.05, the immediate sentiment for Indian equities leans towards mild positive bias. For the Nifty, a critical support level to watch is 23800. If this level holds, it could signal underlying strength and potential for consolidation. Conversely, a breach below 23700 could trigger further selling pressure. On the upside, Nifty faces immediate resistance at 24000. A decisive move and sustained close above 24000 would indicate renewed bullish momentum, potentially attracting further institutional inflows. The direction of FII flows in the coming sessions will be crucial in determining whether these levels hold or are challenged.
Bottom Line
Today’s market action saw Bitcoin dip to $62,245 (₹5,916,387) amidst renewed MidEast conflict, impacting global markets and reinforcing a risk-off sentiment evident in the 0.0281 ETH/BTC ratio. While the Fear & Greed Index at 20 signals extreme fear, historically a zone for contrarian accumulation, Indian investors must meticulously account for the ₹95.05 USD/INR rate and India’s strict 30% crypto tax and 1% TDS rules. FIIs injecting ₹393 Cr into Indian equities today, with Nifty at 23882.05, suggests a nuanced capital flow dynamic where a subset of retail capital, if equity returns falter, often eyes crypto. The immediate future hinges on Bitcoin’s ability to hold key support levels and broader geopolitical de-escalation, influencing both traditional and digital asset markets for Indian portfolios.
For Indian crypto investors, the single most critical factor to watch in the next 24-48 hours will be Bitcoin’s reaction to the $62,000 (₹5,893,100) price level. A failure to hold this key psychological and technical support, especially amidst ongoing geopolitical uncertainty, could trigger a cascade of further selling across the broader altcoin market, including Solana, and signal a deeper correction. Conversely, a strong bounce and reclaim of this level would provide much-needed validation of current market sentiment being oversold and could initiate a short-term recovery, potentially improving the outlook for riskier crypto assets. Monitor this level closely for directional cues.
Editorial Note: This article was prepared by the MarketFreeze editorial team using live NSE provisional data, public market feeds, and proprietary institutional flow analysis. All price and flow figures are sourced directly from NSE, BSE, and CoinGecko as of 08 July 2026. This content is for informational purposes only and does not constitute investment advice. MarketFreeze is not SEBI-registered. Please consult a qualified financial advisor before making investment decisions. Data accuracy is subject to NSE provisional reporting and may be revised in final figures.