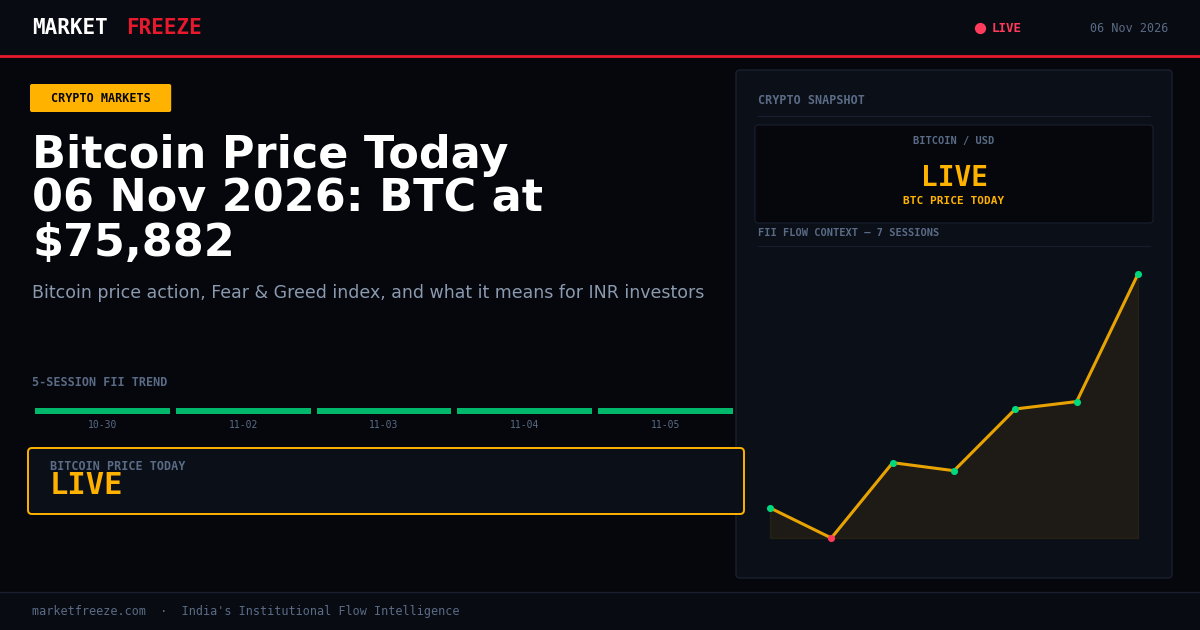
Bitcoin is trading at $75,885 USD, which translates to ₹7,174,167 INR, down 4.70% in the last 24 hours. Today’s crypto market action is heavily influenced by the fallout from Thursday’s AI-led selloff, which saw over $1 billion in bullish bets liquidated across the crypto landscape, according to market reports. This reversal event, which also saw Bitcoin briefly dip below the $76,000 mark, is now casting a shadow as traders await the crucial U.S. jobs figures for further direction.
Open a free demat account with
Upstox
or
Angel One
— zero brokerage on delivery trades.
Market Freeze: Analyzing Today’s Crypto Selloff Amidst Broader Tech Weakness
The cryptocurrency market is experiencing a notable downturn today, with Bitcoin shedding 4.70% of its value to trade at $75,885 USD (₹7,174,167 INR). Ethereum is also under pressure, down 6.26% to $2,240 USD (₹211,769 INR). This broad-based decline mirrors the sentiment seen in global tech equities, which experienced a significant rout yesterday. Reports indicate that over $1 billion in leveraged crypto positions were liquidated as the market reacted to the tech selloff, a phenomenon that has also impacted major indices like the Nasdaq, Nikkei, and Kospi, which saw substantial overnight slumps. The narrative driving this selloff appears to be linked to an AI-led correction, highlighting the interconnectedness between technological innovation, speculative trading, and the broader digital asset class. The current Fear & Greed index reading of 28/100, firmly in the “Fear” territory, suggests that investor sentiment has soured considerably. This level, however, is not unprecedented, and historical data indicates that such readings have often preceded periods of institutional accumulation.
The Indian Rupee’s Role in Local Crypto Investor Returns
For Indian retail investors, the movement of the USD/INR exchange rate plays a critical role in determining the actual returns on their cryptocurrency holdings. Today, the USD/INR is trading at ₹94.54. Given the 4.70% decline in Bitcoin’s USD price, the INR value of Bitcoin has also fallen by a similar magnitude, as the exchange rate has remained relatively stable. If an Indian investor bought Bitcoin when it was priced at $79,000 USD (approximately ₹7,472,740 INR at a USD/INR of 94.59) and now sees it at $75,885 USD (₹7,174,167 INR), they are experiencing a loss not only due to the USD depreciation but also factoring in the INR’s current strength. A stronger INR would exacerbate losses on USD-denominated assets like Bitcoin for Indian investors, while a weaker INR would provide a partial hedge. Today’s figures indicate that while Bitcoin’s USD price has dropped, the relative stability of the USD/INR means the primary driver of losses for Indian investors is the crypto asset’s underlying price depreciation.
Ethereum’s Underperformance and Shifting Altcoin Dynamics
Ethereum is currently showing a steeper decline than Bitcoin, down 6.26% compared to Bitcoin’s 4.70%. This divergence is reflected in the ETH/BTC ratio, which has moved to 0.0295, indicating that Bitcoin is outperforming Ethereum. This underperformance in Ethereum could be a signal of broader concerns within the altcoin market, or specific headwinds facing the second-largest cryptocurrency. Solana, another prominent altcoin, is also trading lower, down 5.38% to $90.21 USD (₹8,528 INR). The general weakness across these major altcoins suggests a risk-off sentiment is prevailing, pushing investors towards perceived safer assets within the crypto ecosystem, which, in this context, appears to be Bitcoin. The lack of specific positive news for Ethereum or Solana today, coupled with the general market downturn, points towards a sentiment of caution, where even established altcoins are struggling to hold their ground against Bitcoin’s relative resilience.
Navigating Fear: What Today’s “Fear & Greed” Reading Suggests
The Fear & Greed index currently stands at a stark 28/100, firmly entrenched in the “Fear” zone. This reading is significant when viewed through the lens of historical market cycles. The provided context highlights that readings within the 25-45 range have historically been indicative of accumulation phases for institutional investors. Specifically, the March 2020 crypto crash and the fourth quarter of 2022 both witnessed sustained institutional buying commence when the Fear & Greed index hovered in this exact territory. Therefore, despite the current price declines and negative sentiment, this reading can be interpreted as a potential buying opportunity for astute investors who are prepared to accumulate assets at a discount. The current low reading, coupled with the broader market volatility, suggests that while short-term sentiment is bearish, the underlying fundamentals for long-term accumulation might be present, a pattern observed in previous market bottoms.
Institutional Flows: FIIs Remain Net Buyers Amidst Crypto Selloff
In a noteworthy development for Indian equities, Foreign Institutional Investors (FIIs) have continued their trend of being net buyers, despite the selloff observed in the cryptocurrency markets today. Today’s FII net flow is recorded at ₹0 Cr, signifying a pause in their aggressive buying spree from previous sessions but maintaining a neutral stance rather than becoming net sellers. This is in contrast to the significant net buying seen in the preceding days, such as the ₹14,974.68 Cr inflow on November 5th. The sustained FII buying interest in Indian equities, even as cryptocurrencies experience a downturn, suggests a divergence in capital allocation strategies. While crypto investors are exhibiting fear, FIIs are exhibiting confidence in the Indian stock market, as evidenced by the Nifty closing at 25030.35. This institutional flow data provides a crucial differentiator for MarketFreeze, connecting the dots between global digital asset movements and the actions of major players in the Indian financial landscape. The fact that FIIs are not pulling back from Indian equities despite crypto weakness is a strong signal of their conviction in the domestic market’s prospects.
Crypto Tax Mechanics: A Hypothetical Sale Scenario
Let’s illustrate the tax implications for an Indian investor. Suppose an investor purchased 0.1 Bitcoin at $70,000 USD (approximately ₹6,618,000 INR at a USD/INR of 94.54) on October 20th, 2026. Today, on November 6th, 2026, this investor decides to sell this 0.1 Bitcoin. The current price is $75,885 USD (₹7,174,167 INR). The profit on this sale would be the difference between the selling price and the buying price in INR. The profit in INR is ₹7,174,167 INR – ₹6,618,000 INR = ₹556,167 INR. Under Indian crypto tax laws, this profit would be taxed at a flat rate of 30% plus applicable surcharges and cess. Therefore, the tax liability on this hypothetical sale would be approximately ₹166,850 INR (30% of ₹556,167 INR) plus cess. This example underscores the importance of tracking purchase and sale prices meticulously to accurately calculate capital gains and the resulting tax obligations. It’s crucial for investors to remain compliant with the regulations, especially when dealing with significant price appreciation as seen in this scenario.
Key Levels to Watch in the Indian Equity Market
The Nifty index closed today at 25030.35, a level that has been steadily climbing over the past week, largely supported by consistent FII inflows. While the crypto market exhibits fear, the Nifty’s upward trajectory suggests a strong underlying demand from institutional players. For immediate support, the psychological level of 25000 is crucial. A sustained breach below this could invite some profit-taking. On the resistance side, the index has been pushing higher with momentum. Any decisive move above 25100 could signal further upside potential, potentially targeting levels around 25200-25300 in the short term, provided FII flows remain positive. The current divergence between crypto fear and equity bullishness indicates that capital is rotating or being allocated with specific sectorial conviction, rather than a broad flight to safety.
The FII-to-Crypto Capital Flow Thesis: A Deeper Dive
The persistent net buying by FIIs in Indian equities, even as cryptocurrencies experience a significant drawdown, presents an intriguing capital flow dynamic. Today’s FII net flow of ₹0 Cr, while flat, follows a period of substantial inflows, with ₹14,974.68 Cr net buying on November 5th alone. This sustained institutional confidence in the Indian stock market, juxtaposed with the current “Fear” reading of 28/100 in crypto, suggests that these two asset classes are not necessarily moving in lockstep for institutional capital allocators. It’s possible that FIIs are rebalancing portfolios, allocating capital towards perceived stability and growth within Indian equities, while viewing cryptocurrencies through a different risk-reward lens, especially during periods of broad tech sector weakness and liquidation events. The lack of significant FII outflow from Indian equities, despite the crypto selloff, reinforces the thesis that institutional money managers are maintaining their long-term strategic positions in India, potentially seeing the current crypto weakness as a short-term anomaly or a different segment of the market altogether. This differentiated approach highlights the sophistication of institutional investment strategies and their ability to navigate diverse market conditions.
Ethereum and the ETH/BTC Ratio: A Signal of Shifting Dominance
The ETH/BTC ratio has moved to 0.0295, indicating that Bitcoin is outperforming Ethereum. This metric is a key indicator of relative strength within the cryptocurrency market. A falling ETH/BTC ratio often suggests that investors are favoring Bitcoin, perhaps due to its status as a more established store of value or during times of heightened risk aversion. Today’s move, coupled with Ethereum’s steeper price decline of 6.26% compared to Bitcoin’s 4.70%, reinforces this trend. This underperformance by Ethereum could be attributed to a variety of factors, including the broader market sentiment, potential profit-taking after recent gains, or specific news impacting the Ethereum ecosystem that is not immediately apparent. For seasoned traders and institutional investors, the ETH/BTC ratio is a vital tool for understanding market leadership and making strategic allocation decisions between the two largest digital assets.
Frequently Asked Questions
Q: What did FII buy or sell on November 5th, 2026?
A: On November 5th, 2026, FIIs were net buyers of +₹14,974.68 Cr in Indian equities, while DIIs were net sellers of ₹-10,444.54 Cr.
Q: What did DII buy on November 3rd, 2026?
A: On November 3rd, 2026, DIIs were net sellers of ₹-3,678.85 Cr in Indian equities.
Q: Is FII buying or selling in November 2026?
A: In November 2026, based on the available data for the initial trading days, FIIs have shown a trend of significant net buying, with a notable inflow of +₹14,974.68 Cr on November 5th, and a neutral stance of ₹0 Cr today, indicating continued overall interest in Indian equities.
Historical Institutional Flows: The Last Five Trading Sessions
| Date | FII Net (Cr) | DII Net (Cr) | Nifty Close |
|---|---|---|---|
| 2026-10-30 | +₹3,598.54 Cr | ₹-817.51 Cr | 23,440.80 |
| 2026-11-02 | +₹3,114.68 Cr | ₹-392.20 Cr | 23,810.85 |
| 2026-11-03 | +₹6,836.81 Cr | ₹-3,678.85 Cr | 23,810.85 |
| 2026-11-04 | +₹7,284.03 Cr | ₹-3,712.23 Cr | 24,536.60 |
| 2026-11-05 | +₹14,974.68 Cr | ₹-10,444.54 Cr | 25,030.35 |
Bottom Line
Today’s crypto market is characterized by a broad selloff, driven by the fallout from yesterday’s tech-led liquidation event, with Bitcoin trading at $75,885 USD (₹7,174,167 INR). While cryptocurrencies are in “Fear” territory, as indicated by the 28/100 Fear & Greed index, Indian equity markets continue to see strong FII interest, with the Nifty closing at 25030.35. The USD/INR rate at ₹94.54 ensures that the primary driver of losses for Indian crypto investors remains the asset’s USD depreciation. The current fear readings in crypto, however, mirror historical accumulation zones, suggesting potential opportunities for the long-term investor.
Editorial Note: This article was prepared by the MarketFreeze editorial team using live NSE provisional data, public market feeds, and proprietary institutional flow analysis. All price and flow figures are sourced directly from NSE, BSE, and CoinGecko as of 06 November 2026. This content is for informational purposes only and does not constitute investment advice. MarketFreeze is not SEBI-registered. Please consult a qualified financial advisor before making investment decisions. Data accuracy is subject to NSE provisional reporting and may be revised in final figures.