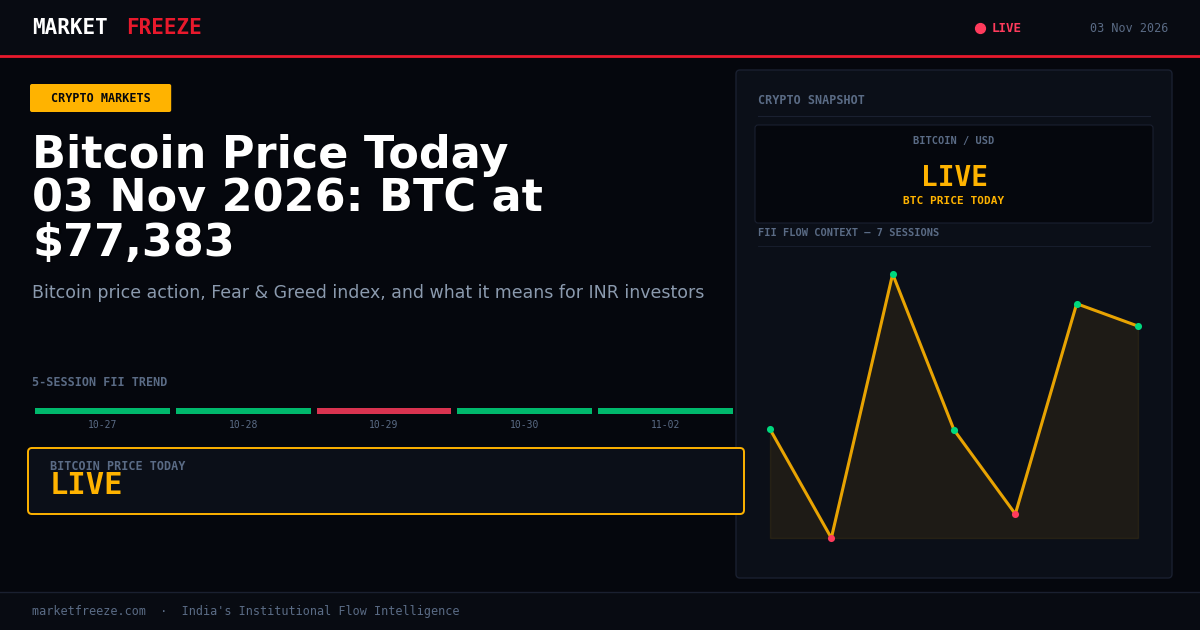
Bitcoin is trading at $77,343 USD (₹7,342,170 INR) today, down 0.33% in the last 24 hours. This price action follows reports of significant net outflows from Binance, reaching $5.3 billion, following a record hack, though the exchange’s CEO indicated recovery efforts are underway with hourly deposits beginning to exceed withdrawals.
Open a free demat account with
Upstox
or
Angel One
— zero brokerage on delivery trades.
Binance Hack Ripples: A Bearish Signal for Bitcoin Amidst ETF Outflows
The substantial net outflows of $5.3 billion from Binance, directly linked to a record hack, appears to be a significant dampener on Bitcoin’s immediate price trajectory. This event, coupled with ongoing outflows from Bitcoin spot ETFs totaling $399 million for a second consecutive day, paints a bearish picture for the flagship cryptocurrency. The exchange’s recovery efforts, while acknowledged by CEO Richard Teng, have not yet fully assuaged investor concerns, leading to a cautious sentiment. The fact that Bitcoin is holding at $77,343 USD (₹7,342,170 INR) despite these headwinds suggests a degree of resilience, but the cumulative pressure from exchange outflows and ETF redemptions is a critical factor to monitor.
USD/INR Dynamics: Fortifying Indian Investor Returns Amidst Crypto Flux
The current USD/INR rate stands at ₹94.93. For Indian retail investors holding cryptocurrencies, this exchange rate plays a crucial role in determining their actual returns in Rupees, regardless of Bitcoin’s USD performance. If an investor were to sell Bitcoin today at $77,343 USD (₹7,342,170 INR), the Rupee equivalent would be calculated using this prevailing exchange rate. A stronger Rupee (lower USD/INR) would diminish the Rupee returns, while a weaker Rupee (higher USD/INR) would amplify them. As Bitcoin experiences a slight dip of 0.33%, the prevailing USD/INR rate of ₹94.93 means that the Rupee value of their holdings remains relatively stable, provided they are not actively converting.
Ethereum’s Stagnation and the ETH/BTC Ratio
Ethereum is showing a slight uptick of 0.09%, trading at $2,280 USD (₹216,440 INR). However, the ETH/BTC ratio has moved to 0.0295, indicating that Bitcoin is exhibiting greater stability compared to Ethereum today. This divergence suggests that while ETH is not experiencing significant downward pressure, it is also not outperforming BTC. The news regarding ETHGas’s ambition to introduce Wall Street-like services on Ethereum, by selling advance block reservations, is an interesting development for the ecosystem. However, the current lack of financial penalties for validators failing to deliver on these commitments might be a point of concern for institutional adoption, potentially limiting its immediate impact on the ETH/BTC ratio.
Solana’s Decline and the Broader Altcoin Landscape
Solana is currently trading at $92.65 USD (₹8,795 INR), reflecting a notable decline of 1.18% in the past 24 hours. This performance, coupled with Bitcoin’s slight dip, suggests a broader cautious sentiment extending to major altcoins. While specific news impacting Solana directly is not highlighted in the provided context, its downward movement is indicative of a general trend where risk-off sentiment in the broader crypto market often leads to sharper declines in altcoins compared to Bitcoin. Investors in altcoins like Solana must be particularly vigilant, as they can experience amplified price swings during periods of market uncertainty, as seen in today’s 1.18% drop.
Investor Sentiment Nears ‘Fear’ Zone: Historical Parallels for Accumulation
The Crypto Fear & Greed Index currently stands at 26/100, firmly in the ‘Fear’ territory. This reading is particularly significant as historical data indicates that periods where the Fear & Greed Index hovers in the 25-45 range have often served as accumulation zones. Both the March 2020 crash and the fourth quarter of 2022 witnessed sustained institutional buying commencing at these low sentiment levels. For Indian retail investors, this presents a potential opportunity to view current price levels not just as a decline, but as a prelude to potential future upside if historical patterns hold true. The sustained institutional buying observed during similar fear-driven periods in the past is a key takeaway here.
FII Flows and Their Crypto Capital Allocation Hypothesis
Foreign Institutional Investor (FII) net activity in Indian equities today is ₹0 Cr, indicating net buyers. This is a crucial data point when juxtaposed with crypto market movements. While today’s FII inflow is neutral in terms of net investment, the preceding sessions have shown significant FII buying. For example, on October 27th, FIIs were net buyers of +₹4,240.39 Cr, and on October 30th, they injected +₹3,598.54 Cr. The thesis suggests that when FIIs are actively deploying capital into Indian equities, a portion of this capital may also find its way into risk assets like cryptocurrencies. The current neutral FII flow does not provide a strong directional signal for crypto capital allocation today, but the trend of buying in recent sessions offers a supportive backdrop for risk assets.
Navigating Crypto Tax Mechanics: A Bitcoin Scenario
Let’s consider a scenario for Indian crypto tax. If an investor purchased Bitcoin at $50,000 USD (₹4,750,000 INR) and today sells it at the current price of $77,343 USD (₹7,342,170 INR), the profit realized would be substantial. The capital gains tax in India on crypto is 30% on profits above a certain threshold, plus applicable cess and surcharge. In this hypothetical sale, the profit would be $27,343 USD (₹2,592,170 INR). This profit would be subject to the 30% tax rate. It’s important for investors to meticulously track their purchase and sale transactions to accurately calculate their tax liability on gains from cryptocurrencies like Bitcoin.
Key Levels to Watch: Nifty’s Support and Resistance in Flow Context
Considering the recent FII and DII flows, Nifty’s current position at 23810.85 suggests a level where further upward movement might encounter resistance unless there’s a sustained increase in institutional buying or a positive catalyst. On the support side, the levels seen during periods of significant FII buying, such as around 22749.75 on October 27th, could act as potential demand zones if market sentiment shifts negatively. The overall trend of FIIs being net buyers in the last five sessions, barring one instance, indicates a general inclination towards the Indian equity market, which can provide a supportive underpinning for Nifty, even amidst global crypto market fluctuations.
FAQ Section
Q: What did FII buy or sell on 2026-10-29?
A: FIIs were net sellers on 2026-10-29, with a net outflow of ₹-943.60 Cr.
Q: What did DII buy on 2026-10-28?
A: DIIs were net buyers on 2026-10-28, with a net inflow of +₹643.35 Cr.
Q: Is FII buying or selling in November 2026?
A: Based on the limited data for November 2026 (up to November 2nd), FIIs have shown a consistent trend of net buying, indicating a bullish stance towards Indian equities.
The recent announcement regarding the proposed implementation of Virtual Digital Asset (VDA) tax regulations in India, particularly the 30% tax on gains from cryptocurrencies, remains a significant factor for Indian investors. This flat tax rate applies regardless of the holding period, differentiating it from traditional capital gains taxes. For instance, if an investor bought Bitcoin at $50,000 USD (₹4,750,000 INR) and sells it today at $77,343 USD (₹7,342,170 INR), realizing a profit of $27,343 USD (₹2,592,170 INR), the entire profit is subject to the 30% tax, amounting to approximately $8,203 USD (₹777,651 INR) in tax, plus any applicable cess and surcharge. Understanding these mechanics is crucial for accurate financial planning and compliance within the Indian regulatory framework.
Key Price Levels and Potential Entry/Exit Strategies
For traders and investors looking to navigate the current market volatility, monitoring specific price levels for Bitcoin and Ethereum is paramount. For Bitcoin, the immediate support can be observed around the $75,000 USD (₹7,118,000 INR) mark. A break below this level, especially on increased volume, could signal further downside towards the $72,000 USD (₹6,837,000 INR) region, which represents a more significant support zone tested during recent consolidation phases. On the upside, resistance is forming near the current trading range, with a decisive move above $78,000 USD (₹7,396,000 INR) potentially opening the path towards the $80,000 USD (₹7,590,000 INR) psychological level.
Ethereum, while currently trading at $2,280 USD (₹216,440 INR), faces similar technical considerations. Immediate support for ETH lies around the $2,250 USD (₹213,900 INR) level. A breach of this could lead to a retest of the $2,150 USD (₹204,000 INR) area. Conversely, bullish momentum would need to push ETH decisively above the $2,350 USD (₹223,000 INR) resistance to challenge higher targets, potentially revisiting the $2,400 USD (₹227,800 INR) mark. These levels are critical for formulating short-term trading strategies and risk management in the current choppy market environment.
Bottom Line
Today’s crypto market is being significantly influenced by the Binance hack and ongoing ETF outflows, placing pressure on Bitcoin. While Ethereum shows minor gains, it’s underperforming Bitcoin. The ‘Fear’ reading on the Fear & Greed Index, however, presents a historical opportunity for accumulation. For Indian investors, the USD/INR rate remains a critical factor in real Rupee returns, while FII flows in Indian equities provide a mixed but generally supportive backdrop for risk assets.
Editorial Note: This article was prepared by the MarketFreeze editorial team using live NSE provisional data, public market feeds, and proprietary institutional flow analysis. All price and flow figures are sourced directly from NSE, BSE, and CoinGecko as of 03 November 2026. This content is for informational purposes only and does not constitute investment advice. MarketFreeze is not SEBI-registered. Please consult a qualified financial advisor before making investment decisions. Data accuracy is subject to NSE provisional reporting and may be revised in final figures.