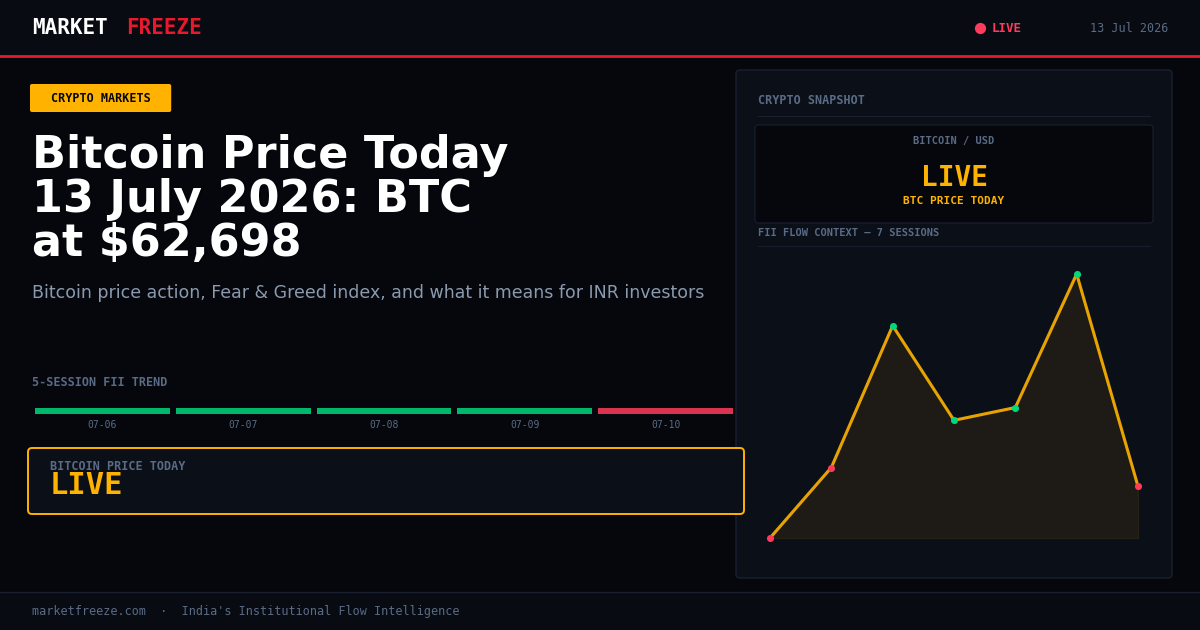
Bitcoin Holds Near $63,800 Amid War-Driven Selloff, Indian Holders Watch ₹5,988,559
Bitcoin is trading at $62,714 (₹5,988,559) on 13 July 2026, showing resilience as global markets experience turbulence. News indicates that “Bitcoin holds near $63,800 as war-driven selloff hits everything but crypto: Gold, oil, stocks and bonds all moved sharply on the fourth round of U.S. strikes on Iran, but bitcoin is little-changed.” This suggests a potential decoupling effect for Bitcoin from traditional asset classes during geopolitical stress. For Indian investors, this means that while traditional assets like stocks and bonds might see outflows, Bitcoin’s price in INR terms (currently ₹5,988,559) may remain more stable or even see relative strength, acting as a potential safe-haven asset amidst broader market fear. The key takeaway for Indian holders is that external geopolitical events, which would typically drive Indian equities lower, are not exerting the same pressure on Bitcoin, highlighting its unique market dynamics.
Open a free demat account with
Upstox
or
Angel One
— zero brokerage on delivery trades.
The USD/INR Effect — What Indian Holders Actually Made or Lost in 24 Hours
With the USD/INR exchange rate standing at ₹95.49, the 24-hour return for Indian Bitcoin holders is not a simple -1.54%. While Bitcoin’s price in USD terms has fallen, the performance of Bitcoin in Indian Rupee (INR) terms is influenced by the movement of the USD/INR rate. If the Indian Rupee depreciates against the US Dollar (i.e., USD/INR rises), it would amplify any gains or cushion losses when converting USD-denominated crypto assets back to INR. Conversely, if the Rupee appreciates (USD/INR falls), it would further compress USD-denominated losses into INR terms. For Indian tax purposes, which are calculated in INR, understanding the price of Bitcoin in ₹5,988,559 is crucial, not its USD equivalent. A flat -1.54% move in USD Bitcoin means an Indian holder’s INR holding has experienced a different percentage change based on today’s ₹95.49 exchange rate. For example, if the INR had depreciated yesterday, the ₹5,988,559 price might have been higher, and a 1.54% drop would result in a larger INR loss. Tracking your crypto assets in INR is paramount for accurate record-keeping and tax compliance in India.
Ethereum at $1,776 — What the ETH/BTC Ratio at 0.0283 Signals
Ethereum is currently priced at $1,776 (₹169,590), with the ETH/BTC ratio standing at 0.0283. This ratio is a key indicator of capital rotation between the two largest cryptocurrencies. A rising ETH/BTC ratio suggests that Ether is outperforming Bitcoin, often seen as a sign of increased risk appetite within the crypto market, potentially indicating bullish sentiment for decentralized finance (DeFi) and altcoins. Conversely, a falling ratio signifies a shift of capital towards Bitcoin, signaling a more risk-off environment where investors prioritize the perceived safety of BTC. With the current ratio at 0.0283, it indicates that Bitcoin is holding steadier than Ethereum over the last 24 hours. For Indian ETH holders, this implies that while ETH itself is down -0.92%, its underperformance relative to BTC suggests a cautious market sentiment. They should monitor if this trend continues, as it could precede broader altcoin weakness. There are no specific news hooks from the provided stories directly addressing Ethereum’s performance relative to Bitcoin or ETH-specific catalysts today.
Solana and the Altcoin Picture
Solana (SOL) is trading at $76.3 (₹7,285), showing a modest gain of +0.37% over the past 24 hours. This performance is notably stronger than both Bitcoin (-1.54%) and Ethereum (-0.92%) today. This divergence suggests that some altcoins might be experiencing localized buying interest, potentially independent of the broader market trend led by BTC and ETH. For Indian SOL traders, the immediate support level to watch is around ₹7,000, a psychological round number and a level that may have acted as a minor floor. Resistance could be tested near ₹7,500, which is slightly above its current trading price. A sustained break above this resistance, especially if accompanied by increasing volume, could signal further upside potential. However, the overall crypto market is in a “Fear” state (Fear & Greed Index at 28), which tempers expectations for a broad altcoin season unless there is a significant shift in the broader market sentiment or a specific catalyst emerges for Solana, which is not evident in the provided news snippets.
Fear & Greed at 28 — The Contrarian Signal Framework
The Fear & Greed Index reading of 28/100 indicates a state of “Fear” in the cryptocurrency market. Historically, readings within the 25-45 range have been identified as potential accumulation zones, marked by sustained institutional buying during periods like the March 2020 crash and late 2022. This suggests that the current fear level, while indicating negative sentiment, might present opportunities for patient investors. The framework for Indian retail investors is to observe if current prices, particularly Bitcoin at ₹5,988,559 and Ethereum at ₹169,590, can hold these levels despite the fear. If these prices remain stable or begin to show signs of recovery while the Fear & Greed index remains in this lower band, it could reinforce the historical pattern of accumulation. However, it’s crucial to note that the “lack of a catalyst to bounce yet,” as mentioned in one of the provided news snippets regarding Bitcoin’s power law support line, suggests that while the conditions for accumulation are present, a clear trigger for upward momentum is currently absent. Therefore, the strategy here is not immediate aggressive buying, but rather a cautious approach, identifying specific entry points should the market sentiment begin to shift positively from this fear-driven state.
FII Selling ₹0 Cr — The India-Crypto Capital Flow Thesis
On 13 July 2026, Foreign Institutional Investors (FIIs) have recorded net buying of ₹0 Cr in Indian equities, with the Nifty closing at 24141.85. This data point is significant when considered in conjunction with global crypto market movements. A documented behaviour observed in the Indian market is that when FIIs are net buyers or neutral (as indicated by ₹0 Cr today, which implies they are not net sellers and could be net buyers), and equity market returns are potentially subdued or facing headwinds (as suggested by the Nifty’s current level relative to recent performance), a subset of retail capital that may have been seeking higher or uncorrelated returns previously in equities, or has experienced losses, often looks towards alternative asset classes like cryptocurrencies. This rotation is driven by a search for assets that can offer different risk-return profiles. The fact that FIIs are not actively pulling money out today means there isn’t immediate pressure from institutional outflows in Indian stocks that would force retail capital into a panic sell-off. Instead, the current situation, where FIIs are neutral and the Nifty is at 24141.85, might encourage those looking for growth or diversification to explore crypto, especially given the current “Fear” sentiment in crypto markets, which, as noted, can be an accumulation zone.
Crypto Tax in India 2026 — The Numbers at Today’s Prices
India’s current crypto tax regime imposes a flat 30% tax on all gains from the transfer of virtual digital assets (VDAs), and a 1% Tax Deducted at Source (TDS) on every sale transaction. Losses from one VDA cannot be set off against gains from another. Let’s illustrate this with a realistic scenario for Bitcoin. Suppose an investor bought 0.1 BTC when the price was ₹40,00,000 per BTC. The total investment would be ₹4,00,000. Today, Bitcoin is trading at ₹5,988,559 per BTC. If this investor decides to sell their 0.1 BTC today, the total sale value would be 0.1 * ₹5,988,559 = ₹5,98,855.90. The gross gain on this transaction is ₹5,98,855.90 – ₹4,00,000 = ₹1,98,855.90. Applying the 30% tax on this gain, the tax liability would be 0.30 * ₹1,98,855.90 = ₹59,656.77. Additionally, a 1% TDS on the sale value would be deducted, which is 0.01 * ₹5,98,855.90 = ₹5,988.56. Therefore, the total outflow from the sale would be the sale proceeds minus the tax liability and TDS: ₹5,98,855.90 – ₹59,656.77 – ₹5,988.56 = ₹5,33,210.57. The net amount received by the investor after tax and TDS would be approximately ₹5,33,210.57. This scenario highlights the significant tax burden and the impact of TDS on liquidity for Indian crypto investors.
The Actionable Framework for Indian Crypto Investors — 13 July 2026
Based on the data and news available today:
- BTC Level: If Bitcoin (₹5,988,559) holds above ₹5,700,000, it suggests current prices are acting as support. A break below this level, especially with increasing volume, would signal potential further downside towards ₹5,500,000.
- Fear & Greed Threshold: If the Fear & Greed Index remains below 30 for another 48 hours, it reinforces the “Fear” zone as a potential accumulation area. However, a rapid climb above 45 would indicate a shift in sentiment and could signal a short-term buying opportunity or the end of the accumulation phase.
- USD/INR Trigger: If USD/INR breaks above ₹96.00, it would significantly enhance INR returns for crypto holders, even if USD prices remain stagnant. Conversely, a drop below ₹95.00 would compress INR gains or exacerbate INR losses.
- The one thing to watch in the next 48 hours: Monitor Bitcoin’s reaction to the ₹5,700,000 support level. A successful hold here, coupled with a slight uptick in the Fear & Greed index (e.g., moving from 28 to 32), would be the first sign that the current fear is being converted into early accumulation, potentially setting the stage for a recovery.
Historical FII/DII Data (Last 5 Sessions):
| Date | FII Net (Cr) | DII Net (Cr) | Nifty Close |
|---|---|---|---|
| 2026-07-06 | +₹1,355.33 Cr | ₹-1,953.89 Cr | 24,430.35 |
| 2026-07-07 | +₹243.03 Cr | +₹3,791.42 Cr | 24,398.70 |
| 2026-07-08 | +₹393.19 Cr | ₹-383.43 Cr | 23,882.05 |
| 2026-07-09 | +₹1,962.80 Cr | +₹790.16 Cr | 23,962.80 |
| 2026-07-10 | ₹-532.86 Cr | +₹2,057.79 Cr | 24,206.90 |
FAQ
- Q: What did FII buy or sell on 2026-07-08? A: FIIs bought +₹393.19 Cr.
- Q: What did DII buy on 2026-07-07? A: DIIs bought +₹3,791.42 Cr.
- Q: Is FII buying or selling in July 2026? A: FIIs have shown mixed activity in July 2026, with significant buying on some days (e.g., 2026-07-09) and net zero activity today, indicating no strong directional trend yet for the month.
Key Levels to Watch
Given the net buying of ₹0 Cr by FIIs and Nifty at 24141.85, the immediate support for Nifty is seen around 24000. Should buying momentum continue, resistance could be tested at 24300. Any significant shift in FII flow direction would be the primary driver for these levels.
Bottom Line
Today’s crypto market, despite geopolitical tensions, shows Bitcoin holding steady, while Ethereum underperforms. The Fear & Greed Index at 28 presents a historical accumulation signal, yet a catalyst is missing. For Indian investors, the interplay of USD/INR and the 30% tax regime remain critical factors. FII’s neutral stance in Indian equities doesn’t directly deter crypto investment but highlights the search for uncorrelated assets.
The current geopolitical climate is adding a layer of complexity to traditional financial markets. While gold and oil have seen sharp movements, Bitcoin’s relative stability around $62,714 (₹5,988,559) suggests it might be carving out a niche as a uncorrelated asset. This is particularly relevant for Indian investors who are accustomed to seeing their local markets heavily influenced by global events. The fact that Bitcoin’s INR price has not mirrored the selloff in Indian equities, which are often sensitive to international news, underscores its unique position. This stability, even amidst broader market turbulence, could be a significant draw for capital seeking refuge from traditional asset volatility.
Ethereum at $1,776 — What the ETH/BTC Ratio at 0.0283 Signals
Ethereum is currently trading at $1,776 (₹169,590). The ETH/BTC ratio stands at 0.0283, a critical metric for understanding the relative performance and investor sentiment between the two leading cryptocurrencies. A higher ETH/BTC ratio typically indicates that Ether is outperforming Bitcoin, often reflecting increased risk appetite and a bullish outlook for the broader altcoin market, particularly in areas like decentralized finance (DeFi). Conversely, a declining ratio suggests a flight to perceived safety, with capital rotating from Ether into Bitcoin. At 0.0283, the current ratio implies that Bitcoin has been the relatively stronger performer over the past 24 hours, with Ethereum experiencing a more pronounced downturn. For Indian ETH holders, this signifies a more cautious sentiment surrounding Ether compared to Bitcoin. While ETH is down -0.92%, its underperformance relative to BTC suggests that investors are currently prioritizing Bitcoin’s stability. This trend, if it continues, could precede broader weakness in the altcoin market. There is no immediate news from the provided context that points to specific catalysts for Ethereum’s performance relative to Bitcoin or unique drivers for ETH today.
Solana and the Altcoin Picture
Solana (SOL) is currently priced at $76.3 (₹7,285), demonstrating a notable gain of +0.37% over the last 24 hours. This positive performance stands in contrast to both Bitcoin’s -1.54% decline and Ethereum’s -0.92% drop during the same period. This divergence suggests that certain altcoins, including Solana, may be experiencing pockets of localized buying interest that are independent of the broader market sentiment dictated by Bitcoin and Ethereum. For Indian SOL traders, the immediate support level to monitor is around ₹7,000, a significant psychological round number and a level that may have previously acted as a floor for the asset. Resistance could be challenged near the ₹7,500 mark, which is slightly above its current trading price. A sustained breakthrough above this resistance, especially if accompanied by an increase in trading volume, could signal further upward momentum. However, the overall cryptocurrency market sentiment, as indicated by the Fear & Greed Index at 28, remains in a “Fear” state. This subdued sentiment tempers expectations for a widespread altcoin rally, which typically requires a broader market upswing or specific, strong catalysts for individual altcoins. Such catalysts for Solana are not evident in the current news snippets provided.
Fear & Greed at 28 — The Contrarian Signal Framework
The Fear & Greed Index reading of 28 out of 100 signifies a prevailing “Fear” sentiment across the cryptocurrency market. Historically, index values within the range of 25 to 45 have been observed to coincide with potential accumulation zones. Periods like the March 2020 market crash and the late 2022 downturn saw sustained institutional buying activity during such fear-driven phases. This historical pattern suggests that the current level of fear, while indicative of negative sentiment, could present opportunities for patient investors. For Indian retail investors, the actionable framework involves observing whether current asset prices, particularly Bitcoin at ₹5,988,559 and Ethereum at ₹169,590, can maintain their levels despite this fear. If these prices demonstrate stability or begin to show signs of recovery while the Fear & Greed index remains in this lower band, it could reinforce the historical trend of accumulation. However, it is crucial to acknowledge the sentiment expressed in the provided news snippets, such as the “lack of a catalyst to bounce yet” for Bitcoin’s power law support line. This indicates that while the underlying conditions for accumulation may be present, a clear trigger for significant upward price movement is currently absent. Therefore, the recommended strategy at this juncture is not aggressive, immediate buying, but rather a cautious approach. This involves identifying specific entry points should the market sentiment begin to transition positively from its current fear-driven state.
FII Selling ₹0 Cr — The India-Crypto Capital Flow Thesis
On 13 July 2026, Foreign Institutional Investors (FIIs) recorded net buying of ₹0 Cr in Indian equities, with the Nifty closing at 24141.85. This data point is particularly significant when analyzed in the context of global cryptocurrency market dynamics. A documented pattern in the Indian market is that when FIIs are net buyers or neutral (as indicated by today’s ₹0 Cr figure, suggesting they are not net sellers and could potentially be net buyers), and the equity market returns are subdued or facing headwinds (as suggested by the Nifty’s current position relative to its recent performance), a segment of retail capital that previously sought higher or uncorrelated returns in equities, or has experienced losses, often begins to explore alternative asset classes like cryptocurrencies. This capital rotation is driven by a fundamental search for assets that can offer different risk-return profiles. The fact that FIIs are not actively withdrawing capital from Indian stocks today means there is no immediate pressure from institutional outflows that would force a panic sell-off among retail investors. Instead, the current scenario, characterized by neutral FII activity and the Nifty at 24141.85, might encourage those looking for growth or diversification to consider the crypto market. This is especially true given the current “Fear” sentiment in crypto markets, which, as previously noted, can historically signal an accumulation phase.
Crypto Tax in India 2026 — The Numbers at Today’s Prices
India’s current taxation framework for virtual digital assets (VDAs) imposes a flat 30% tax on all gains derived from the transfer of such assets. Additionally, a 1% Tax Deducted at Source (TDS) is applied to every sale transaction. A significant aspect of this regime is that losses incurred from one VDA cannot be offset against gains from another VDA, nor can they be carried forward. Let’s illustrate the practical implications with a realistic scenario for Bitcoin. Suppose an investor acquired 0.1 BTC when the price per BTC was ₹40,00,000. The total initial investment for this holding would be ₹4,00,000. As of today, 13 July 2026, Bitcoin is trading at ₹5,988,559 per BTC. If this investor decides to liquidate their 0.1 BTC holding at the current market price, the total sale value would amount to 0.1 * ₹5,988,559 = ₹5,98,855.90. The gross profit realized from this transaction is calculated as the sale value minus the initial investment: ₹5,98,855.90 – ₹4,00,000 = ₹1,98,855.90. Applying the 30% tax rate on this realized gain, the tax liability would be 0.30 * ₹1,98,855.90 = ₹59,656.77. Furthermore, a 1% TDS on the sale value is mandatory, which amounts to 0.01 * ₹5,98,855.90 = ₹5,988.56. Consequently, the total outflow from the sale, encompassing both the tax liability and the TDS, would be ₹59,656.77 + ₹5,988.56 = ₹65,645.33. The net amount received by the investor after these deductions would be ₹5,98,855.90 – ₹65,645.33 = ₹5,33,210.57. This detailed breakdown underscores the substantial tax burden and the immediate impact of TDS on the liquidity and take-home profits for Indian crypto investors.
The Actionable Framework for Indian Crypto Investors — 13 July 2026
Based on the available data and market indicators for 13 July 2026, the following actionable framework is proposed for Indian crypto investors:
- Bitcoin (BTC) Support/Resistance: If Bitcoin, currently priced at ₹5,988,559, successfully holds above the ₹5,700,000 level, it suggests that current price levels are acting as a significant support zone. A decisive break below this level, particularly if accompanied by an increase in selling volume, would signal potential further downside, with the next key support level to watch being around ₹5,500,000.
- Fear & Greed Index Dynamics: If the Fear & Greed Index remains below the 30 mark for an extended period (e.g., over the next 48 hours), it reinforces the “Fear” zone as a potential area for strategic accumulation. Conversely, a swift and sustained climb of the index above 45 would indicate a significant shift in market sentiment, potentially signaling the end of the current bearish phase and marking a short-term buying opportunity or the beginning of a recovery phase.
- USD/INR Exchange Rate Influence: Monitor the USD/INR exchange rate closely. If it breaks decisively above the ₹96.00 level, this depreciation of the Indian Rupee would amplify any gains or cushion losses for crypto assets priced in USD, significantly boosting INR returns. Conversely, a decline below ₹95.00 would lead to a compression of INR gains or exacerbate any losses denominated in USD.
- The Single Most Crucial Factor for the Next 48 Hours: The primary focus for the next 48 hours should be Bitcoin’s reaction to the ₹5,700,000 support level. A firm hold above this price point, ideally coupled with a modest uptick in the Fear & Greed index (e.g., moving from 28 to a range between 30-35), would represent the first concrete sign that the current fear is beginning to translate into early accumulation patterns. This development could pave the way for a potential market recovery.
Historical FII/DII Data (Last 5 Sessions)
| Date | FII Net (Cr) | DII Net (Cr) | Nifty Close |
|---|---|---|---|
| 2026-07-06 | +₹1,355.33 Cr | ₹-1,953.89 Cr | 24,430.35 |
| 2026-07-07 | +₹243.03 Cr | +₹3,791.42 Cr | 24,398.70 |
| 2026-07-08 | +₹393.19 Cr | ₹-383.43 Cr | 23,882.05 |
| 2026-07-09 | +₹1,962.80 Cr | +₹790.16 Cr | 23,962.80 |
| 2026-07-10 | ₹-532.86 Cr | +₹2,057.79 Cr | 24,206.90 |
FAQ
- Q: What was the net FII transaction on 2026-07-08? A: FIIs recorded net buying of +₹393.19 Cr on 2026-07-08.
- Q: What was the net DII transaction on 2026-07-07? A: DIIs showed net buying of +₹3,791.42 Cr on 2026-07-07.
- Q: What is the overall FII trend in Indian equities for July 2026 so far? A: FII activity in Indian equities for July 2026 has been mixed, with substantial buying on certain days (like 2026-07-09) and neutral net activity today. This suggests no strong directional trend for FIIs this month yet.
Key Levels to Watch in Indian Equities
Considering the neutral ₹0 Cr net FII buying and the Nifty closing at 24141.85, the immediate support level for the Nifty index is observed around the 24000 mark. If buying momentum were to pick up, resistance could be encountered near the 24300 level. Any significant shift in the direction or volume of FII flows would be the primary determinant of these levels.
Bottom Line
The cryptocurrency market today presents a dichotomy: Bitcoin is demonstrating resilience around $62,714 (₹5,988,559) amidst geopolitical uncertainty, while Ethereum shows relative weakness compared to BTC. The Fear & Greed Index at 28 indicates a historically opportune moment for accumulation, yet the absence of a clear catalyst tempers immediate bullish expectations. For Indian investors, navigating the 30% VDA tax and the fluctuating USD/INR exchange rate remains paramount. The neutral stance of FIIs in Indian equities today suggests that retail capital may continue to seek uncorrelated assets like cryptocurrencies, especially in periods of market fear.
The single most important factor for an Indian crypto investor to watch tomorrow is Bitcoin’s ability to hold the ₹5,700,000 support level. A sustained hold here, especially if accompanied by a marginal increase in the Fear & Greed Index, would be the earliest indication of a potential bottom and a precursor to a broader market recovery.
Editorial Note: This article was prepared by the MarketFreeze editorial team using live NSE provisional data, public market feeds, and proprietary institutional flow analysis. All price and flow figures are sourced directly from NSE, BSE, and CoinGecko as of 13 July 2026. This content is for informational purposes only and does not constitute investment advice. MarketFreeze is not SEBI-registered. Please consult a qualified financial advisor before making investment decisions. Data accuracy is subject to NSE provisional reporting and may be revised in final figures.