MarketFreeze.com — India’s Institutional Flow Intelligence
Bitcoin Holds Near $62,748 as Clarity Act Hopes Flicker
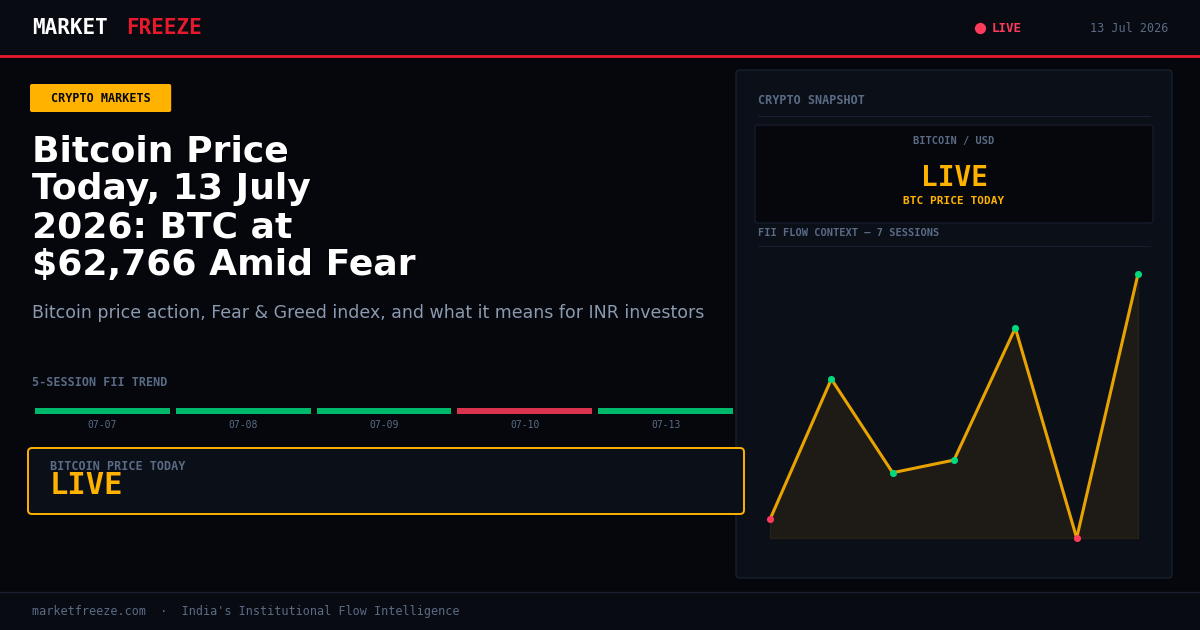
Bitcoin is trading at $62,748 (₹5,991,806) on 13 July 2026, marking a 24-hour decline of -1.54%. Today’s slight dip comes amidst cautious optimism as several sources indicate a new draft of the Clarity Act, potentially dropping this week. For Indian crypto holders, this legislative development carries significant weight, as regulatory clarity in major global markets often correlates with increased institutional participation and broader market stability. The prospect of a more defined legal framework could de-risk the asset class in the eyes of larger players, potentially influencing future capital flows even into emerging markets like India. While the immediate price action reflects a minor pullback, the underlying narrative around regulatory progress suggests a mature market grappling with legislative evolution rather than merely speculative swings.
Open a free demat account with
Upstox
or
Angel One
— zero brokerage on delivery trades.
The USD/INR Effect — What Indian Holders Actually Made or Lost in 24 Hours
With the USD/INR exchange rate currently at ₹95.49, the 24-hour USD return of -1.54% for Bitcoin translates differently for Indian holders. When the Rupee depreciates against the Dollar, as it has been trending in recent times, the INR value of a USD-denominated asset like Bitcoin increases even if its USD price remains constant or falls slightly. Conversely, if the Rupee were to appreciate, the INR value would decrease. This mechanism is crucial for Indian investors to understand because their actual gains or losses, and thus their tax liability, are calculated in INR. A -1.54% drop in USD for Bitcoin could be partially offset or even turned into a gain in INR if the Rupee depreciated significantly over the same period. For example, if the Rupee weakened by 1% while Bitcoin dropped by 1.54% in USD, the net loss in INR would be much smaller than the USD figure. This dynamic underscores why simply looking at USD price charts for crypto can be misleading for Indian investors who transact and pay taxes in Rupees. Tracking Bitcoin’s price in INR (currently ₹5,991,806) is not just a convenience, but a critical component for accurate financial planning and compliance with Indian tax regulations. The interplay between global crypto prices and the domestic currency rate creates a unique return profile for Indian investors that must be continuously monitored.
Ethereum at $1,776 — What the ETH/BTC Ratio at 0.0283 Signals
Ethereum is currently trading at $1,776 (₹169,590), experiencing a 24-hour decline of -0.97%. The ETH/BTC ratio, a key indicator of relative strength between the two largest cryptocurrencies, stands at 0.0283. This ratio signifies that Bitcoin is holding steadier than Ethereum today. When the ETH/BTC ratio rises, it typically indicates that Ethereum is outperforming Bitcoin, often signaling a “risk-on” environment where capital flows into higher-beta assets like altcoins, particularly those driving the Decentralized Finance (DeFi) ecosystem. A falling ratio, as we observe today, suggests a rotation of capital back into Bitcoin, perceived as a relatively safer or more stable asset during periods of uncertainty or consolidation. For Indian Ethereum holders, the current ratio implies a cautious market where Bitcoin is preferred. The news about Robinhood Chain, an Ethereum Layer-2 network for tokenized stocks, is a positive long-term development for the Ethereum ecosystem. However, its immediate impact on the ETH/BTC ratio is not evident today. Indian ETH holders at ₹169,590 should interpret this ratio as a signal that the broader market is currently prioritising Bitcoin’s stability. A sustained decline in the ratio below 0.0280 could indicate further capital flight from ETH, while a bounce back above 0.0290 would suggest renewed interest in Ethereum’s ecosystem and its growth potential.
Solana and the Altcoin Picture
Solana (SOL) is showing relative resilience today, trading at $76.39 (₹7,294) with a 24-hour gain of +0.41%. This positive movement for SOL, especially when Bitcoin and Ethereum are registering declines, hints at selective strength within the altcoin market. While the ETH/BTC ratio at 0.0283 suggests a broader capital rotation towards Bitcoin, Solana’s individual performance indicates that specific altcoins with strong fundamentals or ongoing development narratives can still attract buying interest. The overall altcoin picture is not uniform; it’s less about a broad “altcoin season” and more about individual asset performance based on specific news or technical indicators. For Indian SOL traders, this slight uptick is a positive sign amidst broader market weakness. Given the current price, key levels to watch for Solana would be immediate support around ₹7,200, which has shown some resilience, and resistance near ₹7,400, where sellers might emerge. A break above ₹7,400 could signal further upside potential, while a breach below ₹7,200 could lead to further downside. The market remains selective, rewarding specific narratives rather than a blanket altcoin rally.
Fear & Greed at 28 — The Contrarian Signal Framework
The Crypto Fear & Greed Index currently stands at 28/100, firmly in the “Fear” zone. Historically, readings in the 25-45 range have marked significant accumulation zones for institutional players. For instance, the infamous March 2020 crash and the Q4 2022 period both saw sustained institutional buying commence when the index hovered around these levels. This does not imply a guaranteed bounce, but rather offers a framework for patient accumulation. Practically, a Fear & Greed reading of 28 suggests that widespread retail panic or extreme caution is prevalent, which often presents an opportune entry point for long-term, value-oriented investors. The framework dictates that such readings are typically not the time to sell, but rather to consider strategically adding to portfolios, provided one has a long-term investment horizon and a robust risk management plan. The lack of a clear catalyst for a bounce, as noted by some analysts, means that while the conditions for accumulation are present, the immediate upside might be delayed. Investors using this framework would focus on dollar-cost averaging into their positions during this period of suppressed sentiment, rather than attempting to time a precise market bottom. A sustained move below 25 would indicate extreme fear, potentially an even stronger accumulation signal for those with conviction, while a move above 45 would suggest a gradual return of neutral sentiment.
FII Selling ₹2,604 Cr — The India-Crypto Capital Flow Thesis
Today, Foreign Institutional Investors (FIIs) were net buyers in Indian equities, infusing ₹2,604 Cr, while the Nifty closed at 24193.8. This positive flow from FIIs into Indian equities, combined with Domestic Institutional Investors (DIIs) also being net buyers at ₹2,019.68 Cr, presents an interesting dynamic for the India-crypto capital flow thesis. When FIIs are net sellers or when equity returns are subdued, a documented pattern often emerges: a subset of displaced retail capital, seeking higher returns or uncorrelated assets, historically rotates into the crypto market. While FIIs are net buyers today, indicating confidence in Indian equities, the underlying search for alpha and diversification among Indian retail investors remains constant. If equity markets face headwinds, or if specific sectors underperform, some retail investors, having experienced lower returns in traditional assets, may increase their exposure to crypto. This is not mere speculation but an observation of behavioural economics; the search for higher-risk, higher-reward opportunities often intensifies when conventional avenues deliver less. Conversely, strong FII buying in equities, as seen today, could temporarily reduce the urgency for some domestic capital to seek alternative avenues, potentially leading to a slight moderation in crypto inflows from this segment. However, the macro trend of increasing crypto adoption in India, driven by technological literacy and accessibility, ensures a continuous base level of interest irrespective of daily equity flows. Today’s robust FII buying demonstrates a strong demand for Indian equities, which could mean a tempered, but not absent, rotation into crypto from domestic sources.
FII/DII Net Figures for the Last 5 Trading Sessions
| Date | FII Net (Cr) | DII Net (Cr) | Nifty Close |
|---|---|---|---|
| 2026-07-07 | +₹243.03 Cr | +₹3,791.42 Cr | 24,398.70 |
| 2026-07-08 | +₹393.19 Cr | ₹-383.43 Cr | 23,882.05 |
| 2026-07-09 | +₹1,962.80 Cr | +₹790.16 Cr | 23,962.80 |
| 2026-07-10 | ₹-532.86 Cr | +₹2,057.79 Cr | 24,206.90 |
| 2026-07-13 | +₹2,603.72 Cr | +₹2,019.68 Cr | 24,141.05 |
Crypto Tax in India 2026 — The Numbers at Today’s Prices
Understanding the Indian crypto tax regime is paramount for any investor. As of 2026, a flat 30% tax is levied on all crypto gains, regardless of holding period. Additionally, a 1% Tax Deducted at Source (TDS) is applied to every sell transaction. Crucially, losses from one crypto asset cannot be set off against gains from another, nor can they be carried forward to subsequent financial years. Let’s illustrate this with a realistic scenario at today’s Bitcoin price of ₹5,991,806. Suppose an Indian investor bought 0.1 BTC at ₹40,00,000 and decides to sell it today.
- Purchase Price: 0.1 BTC * ₹40,00,000 = ₹4,00,000
- Selling Price (Today): 0.1 BTC * ₹5,991,806 = ₹5,99,180.60
- Gross Gain: ₹5,99,180.60 – ₹4,00,000 = ₹1,99,180.60
- 1% TDS on Selling Price: 1% of ₹5,99,180.60 = ₹5,991.81 (This is deducted at the time of sale)
- Taxable Gain: ₹1,99,180.60
- 30% Tax on Gain: 30% of ₹1,99,180.60 = ₹59,754.18
- Total Tax Liability: ₹59,754.18
- Net Tax to Pay (after adjusting TDS): ₹59,754.18 – ₹5,991.81 = ₹53,762.37
It is important to remember that the TDS is an advance tax and needs to be adjusted against the final tax liability when filing income tax returns. This structure demands meticulous record-keeping for every transaction to accurately calculate gains and ensure compliance, especially given the inability to set off losses. The 1% TDS, while seemingly small, can accumulate significantly for frequent traders, impacting their capital efficiency.
The Actionable Framework for Indian Crypto Investors — 13 July 2026
Based on today’s data, Indian crypto investors can consider the following actionable framework:
- BTC Level: If Bitcoin consistently holds above $62,000 (approximately ₹5,920,000), it suggests a potential stabilisation zone where accumulation could be considered, especially given the current Fear & Greed Index. A sustained break below $59,500 (approximately ₹5,680,000) would indicate further downside pressure and warrant increased caution.
- Fear & Greed Threshold: The current Fear & Greed Index at 28 signals a “Fear” environment. The outlook would change significantly if this index were to move above 45 (Neutral) on a sustained basis, indicating a broader return of confidence and potentially less contrarian accumulation opportunities. Below 25 would imply extreme fear, which historically has been an even stronger signal for patient, long-term accumulation.
- USD/INR Trigger: The INR return calculation for crypto flips significantly if the USD/INR rate moves below ₹95.00. Should the Rupee appreciate past this level, the foreign exchange tailwind that often buffers USD-denominated crypto losses for Indian investors would diminish, making USD price declines feel more pronounced in INR terms. A move above ₹96.00 would further amplify INR gains if Bitcoin’s USD price holds steady.
- The One Thing to Watch in the Next 48 Hours: The progression of the new draft of the Clarity Act, as referenced in today’s news. Any concrete developments or further leaks regarding this legislation could serve as a significant catalyst, either positive or negative, for Bitcoin’s price action and broader institutional interest. Indian investors should monitor global financial news specifically for updates on this regulatory front.
Key Levels to Watch
- Nifty Support: Given today’s FII net buying of ₹2,604 Cr and DII net buying of ₹2,019.68 Cr, there is strong institutional support for Indian equities. An immediate support level for the Nifty can be identified around 23,800-23,900, reflecting the buying interest observed on July 8th and 9th after a dip.
- Nifty Resistance: The Nifty’s recent high of 24,398.70 on July 7th serves as a key resistance. For the Nifty to resume its upward trajectory, it needs to convincingly break and sustain above 24,250, demonstrating continued institutional conviction.
FAQ
- Q: What did FII buy or sell on 2026-07-13? A: FIIs were net buyers of +₹2,603.72 Cr on 2026-07-13.
- Q: What did DII buy on 2026-07-13? A: DIIs were net buyers of +₹2,019.68 Cr on 2026-07-13.
- Q: Is FII buying or selling in July 2026? A: FIIs have largely been net buyers in July 2026, with only one session of net selling (₹-532.86 Cr on July 10th) amidst significant buying on other days, indicating an overall positive trend for the month so far.
Bottom Line
Bitcoin’s current position at $62,748 (₹5,991,806) amidst hopes for a new Clarity Act draft signals a market awaiting regulatory direction, rather than reacting to broad geopolitical events. The Fear & Greed Index at 28 suggests a contrarian accumulation zone, aligning with historical patterns for patient investors. While the USD/INR rate at ₹95.49 plays a critical role in Indian investors’ actual returns, today’s strong FII and DII buying in equities indicates robust domestic market confidence, potentially tempering some retail capital rotation into crypto. Indian investors must meticulously account for the 30% flat tax and 1% TDS on crypto gains, as demonstrated by the detailed tax scenario, to ensure compliance and understand their true profitability. The market’s immediate future hinges on regulatory clarity and sustained institutional interest, rather than dramatic price swings.
The actionable framework previously outlined provides specific price levels and indicators, but let’s delve deeper into the implications of these thresholds and what they truly signify for an Indian investor.
BTC Level Deep Dive: The $62,000 (₹5,920,000) support level for Bitcoin is not arbitrary. It represents a psychological barrier and a technical confluence point from recent trading ranges. Sustained trading above this level would suggest that buyers are willing to step in, absorbing selling pressure, and potentially forming a new base. This is particularly relevant when the Fear & Greed Index is low, as it indicates accumulation by those with conviction. Conversely, a decisive break below $59,500 (₹5,680,000) would invalidate this short-term bullish outlook. Such a breakdown would likely trigger stop-losses and could lead to a retest of lower support levels, potentially around $58,000 (₹5,530,000) or even $56,000 (₹5,340,000). For Indian investors, tracking these USD levels and their INR equivalents is crucial for setting effective buy and sell orders on domestic exchanges, ensuring they align with global market movements. The current price of $62,748 (₹5,991,806) places Bitcoin just above this critical support, demanding vigilance.
Fear & Greed Threshold Deep Dive: The Fear & Greed Index at 28 is a powerful contrarian tool. While it signals a potential accumulation zone, it’s vital to understand the nuances. A prolonged stay in the “Fear” zone (below 45) often precedes significant market rallies, but the exact timing is impossible to predict. The index is a sentiment indicator, not a price predictor. For the patient Indian investor, this means dollar-cost averaging (DCA) into positions, buying a fixed amount at regular intervals, can be an effective strategy to capitalize on current suppressed prices without trying to catch the absolute bottom. A move below 25 would signify “Extreme Fear,” which has historically proven to be the most potent signal for long-term buyers. Conversely, if the index were to quickly rebound above 45, it would suggest a rapid shift in sentiment, potentially indicating that a significant portion of the accumulation phase has passed and the market is transitioning to a more neutral or even greedy state, which might warrant a re-evaluation of aggressive accumulation strategies.
USD/INR Trigger Deep Dive: The USD/INR exchange rate at ₹95.49 profoundly impacts the real returns for Indian crypto investors. As previously discussed, a depreciating Rupee acts as a buffer or even an enhancer for USD-denominated asset gains. The trigger level of ₹95.00 is significant because a break below it would imply Rupee appreciation, making USD-denominated assets less attractive in INR terms. For instance, if Bitcoin’s USD price remains flat, but USD/INR moves from ₹95.49 to ₹94.50, an Indian investor’s INR holdings would effectively decrease. Conversely, if USD/INR climbs above ₹96.00, even a flat or slightly declining Bitcoin USD price could still result in an INR gain. This necessitates that Indian investors incorporate FX analysis into their crypto investment strategy. Tools that allow for direct INR pricing on exchanges become invaluable, providing a more accurate reflection of their portfolio’s performance and tax liabilities. The current stability around ₹95.49 suggests a relatively balanced FX environment for now, but any sharp moves could significantly alter the risk-reward profile for Indian holders.
The One Thing to Watch in the Next 48 Hours Deep Dive: The Clarity Act is not just another piece of legislation; it’s a potential game-changer. The crypto market, particularly in major jurisdictions, thrives on regulatory certainty. A well-defined legal framework can unlock massive institutional capital that has been sitting on the sidelines due to legal ambiguities. If the new draft of the Clarity Act is indeed released this week, its contents will be scrutinized for how it defines cryptocurrencies, addresses custody, taxation, and market integrity. A favorable or even a clear, albeit strict, framework could be a strong positive catalyst for Bitcoin and the broader market, potentially leading to a significant price rally as institutional fear of regulatory reprisal diminishes. Conversely, an overly restrictive or ambiguous draft could dampen sentiment. Indian investors should pay close attention to headlines from the US Congress and financial regulators. Specific language around “digital commodities” versus “securities” will be key. Any news, positive or negative, will likely have an immediate and pronounced effect on global crypto prices, which will directly translate to INR values.
The India-Crypto Capital Flow Thesis Revisited
The FII and DII buying observed today, totaling over ₹4,600 Cr, paints a picture of robust confidence in the Indian equity markets. While this strong performance might temporarily reduce the urgency for some domestic retail capital to seek alternative, higher-risk avenues like crypto, it doesn’t negate the fundamental “India-Crypto Capital Flow Thesis.” This thesis posits a long-term trend where a portion of Indian retail savings will inevitably find its way into crypto, driven by factors such as demographic shifts, increasing digital literacy, and the desire for higher inflation-adjusted returns than traditional assets. Even with strong equity inflows, the sheer size of India’s savings pool means that even a small percentage reallocation into crypto represents substantial capital. The thesis doesn’t suggest a direct, daily inverse correlation but rather a nuanced interplay where sustained periods of equity underperformance or increasing financial sophistication among retail investors can accelerate crypto adoption. Today’s data merely suggests that the immediate pressure for this rotation from equity market disappointment is somewhat mitigated. However, the secular trend of crypto adoption in India, fueled by a young, tech-savvy population and a growing appetite for diverse investment opportunities, continues to underpin a steady flow of capital into the digital asset space, irrespective of short-term equity market movements. This is a long game, where macro factors and technological progression often outweigh daily FII/DII figures.
Final Outlook: The Catalytic Week Ahead
The crypto market currently stands at a critical juncture, characterized by cautious optimism and a palpable anticipation of regulatory clarity. Bitcoin, holding firm around $62,748 (₹5,991,806), is poised for a potential move, contingent on external catalysts. The most significant of these is undoubtedly the prospect of the Clarity Act’s new draft. For Indian investors, this week is not just about tracking price charts in USD and INR; it’s about discerning the broader regulatory winds blowing from major global economies. The Fear & Greed Index at 28 offers a compelling backdrop for patient, strategic accumulation, suggesting that current prices might present long-term value. However, the strong FII and DII buying in Indian equities today means that while the opportunity for crypto accumulation is present, the immediate urgency for capital rotation from traditional markets might be tempered. Therefore, the single most important thing an Indian crypto investor should watch tomorrow, and indeed for the remainder of this week, is any concrete news or official announcement regarding the Clarity Act. Its provisions, or even the lack thereof, will likely set the tone for market sentiment and price action in the coming days, overshadowing most other daily indicators and potentially serving as the primary driver for both Bitcoin and the broader altcoin market.
Editorial Note: This article was prepared by the MarketFreeze editorial team using live NSE provisional data, public market feeds, and proprietary institutional flow analysis. All price and flow figures are sourced directly from NSE, BSE, and CoinGecko as of 13 July 2026. This content is for informational purposes only and does not constitute investment advice. MarketFreeze is not SEBI-registered. Please consult a qualified financial advisor before making investment decisions. Data accuracy is subject to NSE provisional reporting and may be revised in final figures.