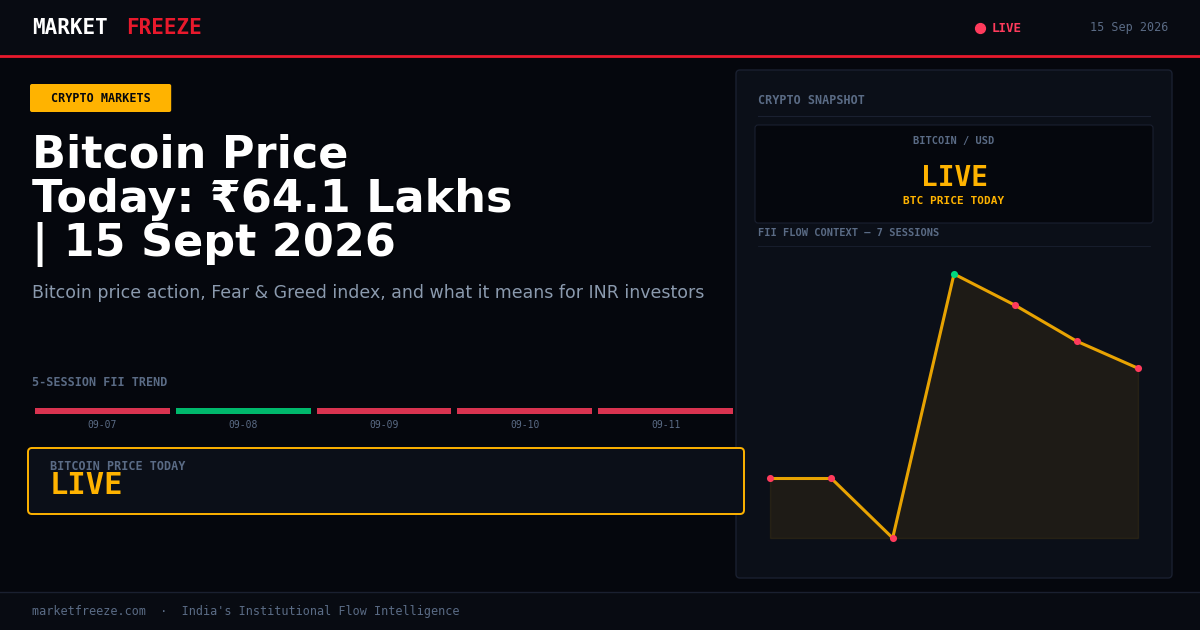
Bitcoin (BTC) today stands at $76,898 USD or ₹7,356,831 INR, experiencing a slight dip of -1.28% over the last 24 hours. This modest pullback comes amidst renewed discussions in Washington surrounding the potential passage of the Clarity Act, a legislative effort aimed at providing much-needed regulatory relief and certainty for the digital asset industry.
Clarity Act Hopes: A Glimmer for Digital Assets Amidst Price Dips
The cryptocurrency market, while seeing minor downward price movements today, remains abuzz with the potential implications of the Clarity Act. Advocates like Representative Shri Thanedar (D-Mich.) are pushing for Congress to secure the 60 Senators needed to pass the bill, arguing it is essential for fostering permanent economic innovation in the digital asset space. This sentiment is echoed by industry leaders such as Alex Tapscott, CEO of CMCC Global Capital Markets, who posits that traditional banks could be the primary beneficiaries of such regulatory clarity.
While Bitcoin dipped by -1.28% to $76,898 USD (₹7,356,831 INR) and Ethereum by -1.48% to $2,475 USD (₹236,783 INR), the conversation around the Clarity Act suggests that underlying fundamental developments are increasingly influencing market narratives beyond day-to-day price fluctuations. The expectation is that regulatory certainty could unlock significant institutional capital and traditional finance integration into the crypto ecosystem, potentially fueling long-term growth for assets like Ether, Solana, and XRP, as highlighted in today’s market outlooks.
Such legislative clarity would be a significant step towards mainstream adoption, transforming the landscape for both investors and developers. For Indian investors, regulatory progress in major global markets like the US often translates into broader market stability and increased confidence, which can indirectly influence domestic sentiment and even capital flows into local crypto exchanges, despite the current tax regime.
Open a free demat account with
Upstox
or
Angel One
— zero brokerage on delivery trades.
USD/INR Dynamics: Shielding or Amplifying Crypto Returns for Indian Holders
The current exchange rate of ₹95.67 for every $1 USD plays a crucial role in determining the true returns for Indian crypto investors. While Bitcoin saw a -1.28% decline in USD terms today, its INR equivalent still translates to a substantial figure of ₹7,356,831. This illustrates how a strong USD/INR rate can sometimes cushion the impact of global market downturns for Indian holders, or conversely, amplify gains during bull runs.
For an Indian investor who held 1 BTC when it was, for example, $70,000 USD and the USD/INR was ₹90, their initial investment was ₹6,300,000. Today, even with the -1.28% dip in BTC’s USD value, the stronger USD/INR at ₹95.67 means their 1 BTC is worth ₹7,356,831. This demonstrates a significant appreciation in INR terms, driven partly by the depreciating rupee, despite the minor USD-denominated price correction. The interplay between global crypto prices and the domestic exchange rate is a critical factor for Indian investors to monitor, as it directly impacts their portfolio’s real-world value.
Ethereum’s Underperformance Against Bitcoin: The ETH/BTC Ratio Tells a Story
Today, Ethereum (ETH) is trading at $2,475 USD (₹236,783 INR), with a 24-hour decline of -1.48%. This contrasts with Bitcoin’s (BTC) -1.28% dip, resulting in an ETH/BTC ratio of 0.0322. This specific ratio indicates that Bitcoin is currently outperforming Ethereum, a notable trend for investors closely watching the relative strength of the two largest cryptocurrencies.
An ETH/BTC ratio of 0.0322, compared to higher levels seen earlier in the year, suggests a flight to perceived safety within the crypto market, where Bitcoin often acts as the primary store of value during periods of uncertainty or minor corrections. While the Clarity Act discussions could eventually benefit Ethereum due to its ecosystem’s innovation potential, the immediate market reaction sees capital favoring Bitcoin. This dynamic is crucial for portfolio allocation decisions, especially for those who diversify across both major assets. A sustained downward trend in the ETH/BTC ratio could indicate a broader market preference for Bitcoin’s stability, potentially signaling a period where “blue-chip” dominance is reasserted.
Solana’s Resilient Stand and Institutional Endorsement
Amidst the slight market downturn, Solana (SOL) is showing notable resilience, with only a -0.16% dip over the last 24 hours, trading at $100.94 USD (₹9,656 INR). This relative stability is further underscored by significant institutional activity. DeFi Development Corp, a prominent Solana Treasury Firm, has rolled out a $300 million CHAD program specifically to acquire more SOL. The firm added another 55,491 SOL, extending a rapid three-week surge of capital markets engagement for the network.
This institutional backing is a strong positive signal for Solana, suggesting continued confidence in its technological capabilities and growth prospects, even as the broader market experiences minor corrections. The deployment of substantial capital into SOL by a dedicated treasury firm highlights a conviction that Solana’s ecosystem will continue to expand and capture significant market share. For Indian investors, Solana’s strong institutional interest and relative price stability today could make it an attractive consideration for diversification, offering exposure to a high-throughput blockchain with growing real-world utility.
Fear & Greed Index: Cautionary Signals at ‘Greed’ Level 69
The Crypto Fear & Greed Index currently sits at 69/100, indicating a state of ‘Greed’ in the market. While this suggests positive sentiment, historical data provides a crucial context for Indian investors. Greed readings above 60 have historically preceded short-term corrections of 5-15% within 2-4 weeks. Though strong bull cycles, such as those witnessed in 2020-21, saw greed sustain above 75 for months, the current level warrants a degree of caution.
For Indian investors, a ‘Greed’ reading of 69 should prompt a review of portfolio risk. While not an immediate sell signal, it suggests that the market may be approaching a point where a minor correction is statistically more likely. This is a time to avoid chasing pumps and instead consider taking some profits, rebalancing portfolios, or setting stop-loss orders to protect gains. The current Nifty close at 23118.6 also factors into this broader market psychology, as domestic equity market sentiment often correlates with crypto movements in the minds of many Indian retail investors.
FII/DII Flows and Nifty’s Trajectory: A Tale of Domestic Support
Today, Foreign Institutional Investors (FIIs) were net buyers in Indian equities, registering ₹0 Cr. While seemingly neutral, this marks a shift from recent trends where FIIs have been net sellers. The Nifty closed today at 23118.6. Let’s examine the FII and DII flows over the past five sessions:
| Date | FII Net (Cr) | DII Net (Cr) | Nifty Close |
|---|---|---|---|
| 2026-09-07 | ₹-3,111.94 Cr | +₹8,930.12 Cr | 23,779.15 |
| 2026-09-08 | +₹280.13 Cr | +₹566.76 Cr | 23,635.10 |
| 2026-09-09 | ₹-123.19 Cr | +₹1,349.64 Cr | 23,431.50 |
| 2026-09-10 | ₹-582.99 Cr | +₹1,509.04 Cr | 23,477.80 |
| 2026-09-11 | ₹-930.90 Cr | +₹1,968.17 Cr | 23,118.60 |
Over the last five trading sessions, FIIs have largely been net sellers, with significant outflows on September 7th (₹-3,111.94 Cr) and continued selling until September 11th (₹-930.90 Cr). In contrast, Domestic Institutional Investors (DIIs) have been consistently strong net buyers, absorbing the FII selling pressure. This consistent DII support has been a crucial factor in preventing a more significant downturn in the Nifty, even as it has slipped from 23,779.15 on September 7th to 23,118.60 today.
The net ₹0 Cr FII flow today, while not a strong buying signal, represents a pause in the recent selling trend. This dynamic highlights the resilience of the Indian equity market, primarily driven by strong domestic liquidity. For crypto investors, this indicates that local capital pools remain robust, which can indirectly support crypto investments by fostering overall economic confidence and potentially freeing up discretionary income for digital assets.
Illustrating Crypto Tax Mechanics with Today’s Bitcoin Price
Understanding the tax implications for crypto assets in India is crucial for any investor. Let’s consider a scenario for an Indian resident selling Bitcoin today, factoring in the current price of $76,898 USD or ₹7,356,831 INR.
Suppose an investor purchased 0.1 BTC at ₹6,500,000 INR per BTC a year ago. Their total acquisition cost for 0.1 BTC would be ₹650,000. If they decide to sell this 0.1 BTC today, the sale value would be 0.1 * ₹7,356,831 = ₹735,683.1.
Calculation of Taxable Gain:
- Sale Value: ₹735,683.1
- Acquisition Cost: ₹650,000
- Gain: ₹735,683.1 – ₹650,000 = ₹85,683.1
Under current Indian tax laws, any income from the transfer of Virtual Digital Assets (VDAs) is taxed at a flat rate of 30%, irrespective of the holding period. Additionally, no deduction for any expenditure (other than the cost of acquisition) or allowance is permitted. Losses from the transfer of VDAs cannot be set off against any other income and cannot be carried forward to subsequent assessment years. A 1% TDS (Tax Deducted at Source) is also applicable on VDA transactions exceeding certain thresholds.
For our example, the tax payable on the gain of ₹85,683.1 would be:
30% of ₹85,683.1 = ₹25,704.93.
Additionally, if the transaction value exceeded the specified threshold (e.g., ₹10,000 in a financial year for non-specified persons), a 1% TDS would be deducted at the source on the sale value of ₹735,683.1, amounting to ₹7,356.83. This TDS amount can be adjusted against the final tax liability.
This illustrates the direct and significant impact of India’s crypto tax framework on net returns, reinforcing the importance of factoring in tax liabilities when evaluating crypto investments.
Key Levels to Watch for Nifty Based on Institutional Flow Dynamics
Given the recent institutional flow data, particularly the consistent DII buying offsetting FII selling, we can identify key levels for the Nifty 23118.6 that Indian investors should monitor closely:
1. Immediate Support Level: 23100-23050
- The Nifty closed at 23118.6 today, following a decline from 23,779.15 on September 7th. The strong DII buying on September 11th, with +₹1,968.17 Cr, provided crucial support around this zone. If FII selling resumes and intensifies, this level will be the first test of DII’s resolve. A break below 23050 could signal further weakness, as it would imply DIIs are struggling to absorb selling pressure.
2. Strong Support Zone: 22800-22900
- Looking at the broader trend of DII buying, there appears to be a robust accumulation zone in the 22800-22900 range. This would likely be a level where DIIs step in aggressively to protect previous gains and the market’s upward structure. Significant FII outflows below 23050 would likely find a strong floor here, representing a key psychological and technical area where domestic capital is concentrated.
3. Immediate Resistance Level: 23400-23500
- Following the consistent FII selling pressure over the last week, the Nifty failed to sustain above 23477.80 on September 10th. This range, specifically around the 23431.50 and 23477.80 levels from September 9th and 10th, now acts as a key resistance. For the Nifty to regain positive momentum, it needs to convincingly break and hold above this zone, signaling a potential reversal in the short-term downtrend. A strong break above 23500, coupled with renewed FII buying, would be a bullish indicator.
4. Critical Overhead Resistance: 23700-23800
- The previous high of 23,779.15 from September 7th represents a significant overhead resistance. A move back towards this level would require a substantial shift in FII sentiment from net sellers to consistent net buyers, along with continued strong DII support. Crossing this threshold would indicate a resumption of the broader uptrend for the Nifty.
Investors should monitor FII and DII flows daily, as their interaction will dictate whether the Nifty consolidates around current levels or attempts to retest higher resistance points. Consistent DII buying provides a stable base, but a lack of FII participation above current levels could cap rallies.
FAQ
Q: What did FII buy or sell on 2026-09-07?
A: On 2026-09-07, FIIs were net sellers in Indian equities, with an outflow of ₹-3,111.94 Cr.
Q: What did DII buy on 2026-09-11?
A: On 2026-09-11, DIIs were strong net buyers in Indian equities, with an inflow of +₹1,968.17 Cr.
Q: Is FII buying or selling in September 2026?
A: In September 2026, FIIs have largely been net sellers, particularly from September 7th to September 11th, with today’s flow showing a neutral ₹0 Cr. This indicates a general trend of outflows for the month so far.
Bottom Line
Today’s crypto market sees Bitcoin at $76,898 USD (₹7,356,831 INR) with a slight dip, as discussions around the US Clarity Act offer a potential long-term catalyst. The ETH/BTC ratio of 0.0322 signals Bitcoin’s outperformance, while Solana’s resilience, trading at $100.94 USD (₹9,656 INR), is bolstered by significant institutional backing. The ‘Greed’ reading of 69 on the Fear & Greed Index suggests caution for Indian investors, aligning with the Nifty’s recent decline to 23118.6 and consistent DII support offsetting FII selling. The interplay of global crypto developments, the USD/INR rate, and domestic institutional flows continues to shape the landscape for Indian retail investors, demanding a nuanced approach to portfolio management.
Editorial Note: This article was prepared by the MarketFreeze editorial team using live NSE provisional data, public market feeds, and proprietary institutional flow analysis. All price and flow figures are sourced directly from NSE, BSE, and CoinGecko as of 15 September 2026. This content is for informational purposes only and does not constitute investment advice. MarketFreeze is not SEBI-registered. Please consult a qualified financial advisor before making investment decisions. Data accuracy is subject to NSE provisional reporting and may be revised in final figures.