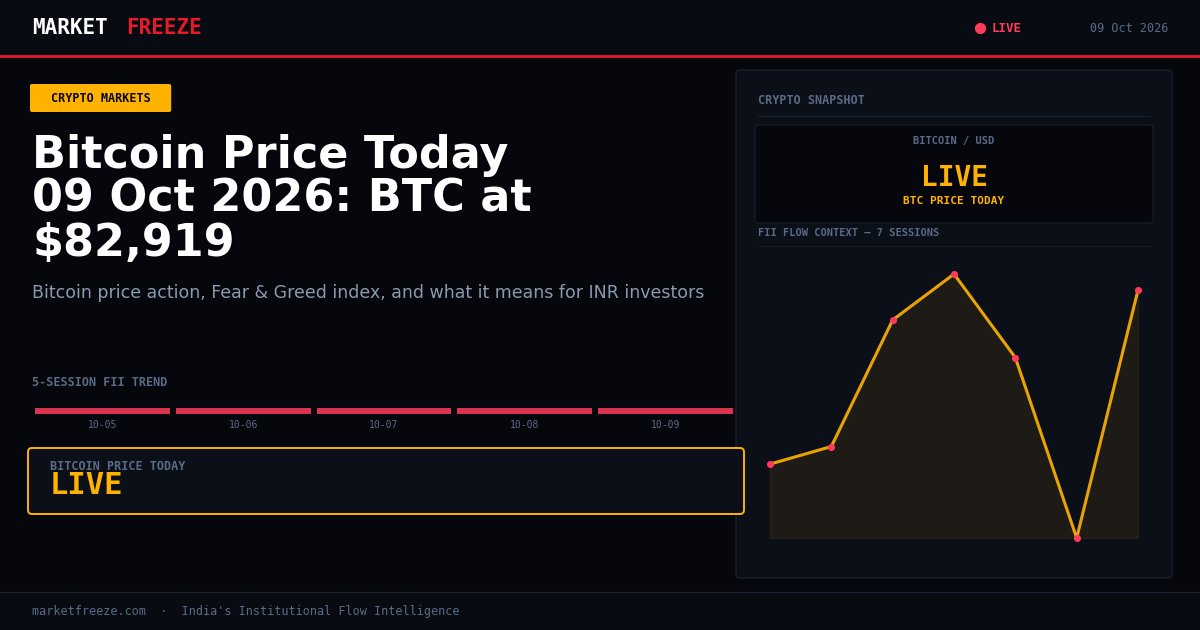
Bitcoin is trading at $82,944 USD (₹8,035,614 INR) today, Oct. 9, 2026, as geopolitical tensions simmer and influence digital asset movements. This price action follows reports that Bitcoin steadied near the $82,500 mark after former President Trump ruled out an Iran strike before the midterms, though the digital asset remains approximately 4% lower on the week. Ethereum, meanwhile, has seen a more pronounced weekly decline of 9%.
Open a free demat account with
Upstox
or
Angel One
— zero brokerage on delivery trades.
Geopolitical Ripples and Bitcoin’s Resilience
The latest crypto market movements are demonstrably tied to shifts in geopolitical outlooks, as evidenced by Bitcoin’s reaction to news regarding former President Trump’s stance on potential Iran strikes. While Bitcoin managed to stabilize around $82,500 USD (₹8,003,125 INR) following this development, its weekly performance has been impacted, declining by 4%. This contrasts with Ethereum, which has experienced a more significant downturn of 9% over the same period. The market’s sensitivity to such news underscores the interconnectedness of global events and digital asset valuations. Experts are weighing in on Bitcoin’s potential trajectory, with some highlighting support levels as low as $72,000 USD (₹6,979,200 INR) in what is being termed a bearish start to “Uptober.” This suggests that despite short-term stabilization, underlying pressures could lead to further price discovery downwards for Bitcoin.
USD/INR Dynamics and Indian Crypto Investor Returns
The current USD/INR exchange rate stands at ₹96.88. For Indian investors holding cryptocurrencies denominated in USD, this prevailing exchange rate plays a crucial role in their actual returns. A stronger USD relative to the INR, as indicated by the current rate, generally enhances the INR value of USD-denominated crypto holdings, assuming the crypto asset’s USD price remains constant or increases. However, today’s price action shows Bitcoin up 0.69% and Ethereum down 1.63% in USD terms. If an Indian investor were to convert their Ethereum holdings back to INR today, the INR depreciation would partially offset the USD price decline, leading to a slightly less severe loss in INR terms compared to the USD loss. Conversely, for Bitcoin, the appreciation in USD terms would be amplified by the current USD/INR rate, providing a more significant INR gain than the USD percentage suggests.
Ethereum’s Underperformance and the ETH/BTC Ratio
Ethereum is currently trading at $2,493 USD (₹241,521 INR), marking a 1.63% decline in the last 24 hours. This underperformance is further highlighted by the ETH/BTC ratio, which has fallen to 0.0301. This ratio indicates that Bitcoin is outperforming Ethereum on a relative basis today. The move in the ETH/BTC ratio to 0.0301 signifies that for every Bitcoin, one could purchase 0.0301 Ethereum. A declining ETH/BTC ratio typically suggests that investors are favoring Bitcoin over Ethereum, potentially due to Bitcoin’s perceived status as a more stable store of value or its greater resilience in the current market climate. This divergence in performance between the two largest cryptocurrencies warrants close observation, as it can signal broader trends within the altcoin market.
Altcoin Landscape: Solana’s Decline and Broader Market Trends
Solana is currently priced at $110.13 USD (₹10,669 INR), experiencing a 1.96% decrease in the past 24 hours. This decline in Solana’s price, alongside Ethereum’s more significant drop, paints a cautious picture for the broader altcoin market. While specific news driving Solana’s movement today is not immediately apparent from the provided crypto headlines, its performance is indicative of a general trend where larger cap altcoins are mirroring some of Ethereum’s weakness. The current “Greed” reading on the Fear & Greed index suggests that despite some individual asset downturns, overall market participants may still be exhibiting optimistic behavior, though this could be a precursor to a correction if underlying fundamentals do not support current valuations.
Fear & Greed Index: Navigating the “Greed” Zone
The Fear & Greed index currently stands at 59 out of 100, signaling a state of “Greed” in the market. Historically, neutral Fear & Greed readings, typically between 45 and 60, have preceded significant directional moves in the market, making the index less reliable as a contrarian signal within this range. A reading of 59, firmly in the “Greed” territory, suggests that market participants are exhibiting optimism and potentially driving prices higher through speculative buying. However, this level also carries the risk of a short-term pullback as the market might be overheated. Investors should exercise caution, as a sustained period of “Greed” can sometimes precede a sharp correction if prices have moved too far, too fast without corresponding fundamental justification.
FII Flows and Their Potential Crypto Correlation
Today, Foreign Institutional Investors (FIIs) have been net sellers in Indian equities, offloading ₹3,569 Cr. This outflow from the Indian stock market comes after a period of significant selling pressure on Oct. 8, 2026, where FIIs sold ₹12,943.58 Cr. While direct, on-chain correlation between FII equity flows and crypto asset purchases is complex and not always immediate, a sustained trend of FII outflows from Indian equities can sometimes be indicative of a broader risk-off sentiment or a reallocation of capital away from emerging markets. If FIIs are reducing their exposure to Indian equities, it’s plausible that some of this capital might find its way into perceived alternative assets, including cryptocurrencies, especially if they are seeking diversification or higher potential returns. Conversely, significant outflows might also suggest a general deleveraging across asset classes.
Crypto Tax Illustration: A Hypothetical Bitcoin Transaction
Let’s consider a hypothetical scenario for Indian investors. Suppose an investor purchased 0.1 Bitcoin on January 15, 2026, at an average price of $40,000 USD (₹3,872,000 INR) per BTC. Today, on October 9, 2026, they decide to sell this 0.1 Bitcoin at the current price of $82,944 USD (₹8,035,614 INR) per BTC. The total sale value in USD would be $8,294.40 USD (₹803,561.4 INR), and the initial purchase cost was $4,000 USD (₹387,200 INR). This results in a capital gain of $4,294.40 USD (₹416,361.4 INR). Under current Indian tax regulations for virtual digital assets (VDAs), this gain would be subject to a flat 30% tax, plus applicable surcharges and cess. Therefore, the tax liability on this transaction would be approximately 30% of ₹416,361.4 INR, which is ₹124,908.42 INR, before considering any potential cess or surcharge. This example highlights the importance of tracking purchase and sale prices accurately for tax reporting purposes.
Key Levels to Watch for Nifty Amidst FII Activity
The Nifty closed today at 22520.45. With FIIs continuing their net selling trend, albeit at a reduced pace today compared to recent sessions, the immediate support for the Nifty appears to be around the 22,231.80 level, which was the close on October 8, 2026, when FII selling was at its peak (₹12,943.58 Cr). Resistance may be found near the 22,776.10 level, representing the Nifty’s close on October 5 and 6, 2026, a period with substantial FII selling as well. The ability of Domestic Institutional Investors (DIIs) to absorb FII selling, as they have consistently done over the last five sessions, will be critical in determining the Nifty’s direction. Today’s DII net inflow of ₹4,743.26 Cr, while lower than the preceding days, still indicates their supportive stance.
FII/DII Flow Table
| Date | FII Net (Cr) | DII Net (Cr) | Nifty Close |
|---|---|---|---|
| 2026-10-05 | ₹-4,699.14 Cr | +₹5,181.62 Cr | 22,776.10 |
| 2026-10-06 | ₹-2,961.30 Cr | +₹5,088.92 Cr | 22,776.10 |
| 2026-10-07 | ₹-6,121.37 Cr | +₹4,596.57 Cr | 22,603.05 |
| 2026-10-08 | ₹-12,943.58 Cr | +₹10,703.11 Cr | 22,231.80 |
| 2026-10-09 | ₹-3,568.90 Cr | +₹4,743.26 Cr | 22,520.45 |
FAQ
Q: What did FII buy or sell on October 7, 2026?
A: FIIs were net sellers of ₹-6,121.37 Cr in Indian equities on October 7, 2026.
Q: What did DII buy on October 8, 2026?
A: DIIs were net buyers of +₹10,703.11 Cr in Indian equities on October 8, 2026.
Q: Is FII buying or selling in October 2026?
A: In October 2026, FIIs have predominantly been net sellers, with significant outflows recorded on multiple trading days, indicating a cautious approach towards Indian equities this month.
VDA Tax Implications for Indian Investors: A Deeper Dive
The hypothetical Bitcoin transaction earlier illustrated the 30% tax on capital gains from Virtual Digital Assets (VDAs) in India. It’s crucial for Indian crypto investors to understand that this tax rate applies irrespective of the holding period. Unlike traditional capital gains on stocks or assets, there is no distinction between short-term and long-term VDA gains. Furthermore, the calculation of gains is based on the difference between the sale price and the purchase price. If the sale price is lower than the purchase price, there is no capital gain to be taxed. However, losses from VDA transactions cannot be set off against gains from other VDAs or any other income. These losses also cannot be carried forward to future financial years. For instance, if an investor sold 0.1 Bitcoin today for $7,000 USD (₹678,160 INR) after buying it for $10,000 USD (₹968,800 INR), they would incur a loss of $3,000 USD (₹280,640 INR) which is not tax-deductible. This strict tax regime necessitates careful portfolio management and tax planning for crypto holdings.
Actionable Framework: Key Levels for Bitcoin and Ethereum
Given the current market volatility and geopolitical undercurrents, investors are keenly watching key support and resistance levels for Bitcoin and Ethereum. For Bitcoin, the immediate support to monitor is around the $72,000 USD (₹6,979,200 INR) mark, as mentioned earlier. A decisive break below this level could trigger further downside pressure, potentially testing the $65,000 USD (₹6,304,200 INR) area. On the upside, resistance lies around the current trading range’s upper bounds, near $85,000 USD (₹8,241,600 INR). A sustained move above this level would be required to signal a potential reversal. For Ethereum, the current support is around the $2,400 USD (₹232,512 INR) mark. A breach of this could lead to a retest of the $2,150 USD (₹208,292 INR) level. Resistance for Ethereum is currently situated around the $2,600 USD (₹251,888 INR) to $2,700 USD (₹261,592 INR) range. The ETH/BTC ratio hovering at 0.0301 suggests that Bitcoin is the relatively stronger asset, and this dynamic is likely to persist until there are significant catalysts for Ethereum’s outperformance.
Bottom Line
Today’s crypto market shows Bitcoin trading at $82,944 USD (₹8,035,614 INR), exhibiting relative resilience amidst broader geopolitical news impacting digital assets. Ethereum’s underperformance and a declining ETH/BTC ratio suggest a preference for Bitcoin in the current environment. For Indian investors, the USD/INR rate of ₹96.88 influences their actual returns. Meanwhile, FIIs continue to be net sellers in Indian equities, offloading ₹3,569 Cr today, a trend that warrants monitoring for potential spillover effects into other asset classes.
Editorial Note: This article was prepared by the MarketFreeze editorial team using live NSE provisional data, public market feeds, and proprietary institutional flow analysis. All price and flow figures are sourced directly from NSE, BSE, and CoinGecko as of 09 October 2026. This content is for informational purposes only and does not constitute investment advice. MarketFreeze is not SEBI-registered. Please consult a qualified financial advisor before making investment decisions. Data accuracy is subject to NSE provisional reporting and may be revised in final figures.