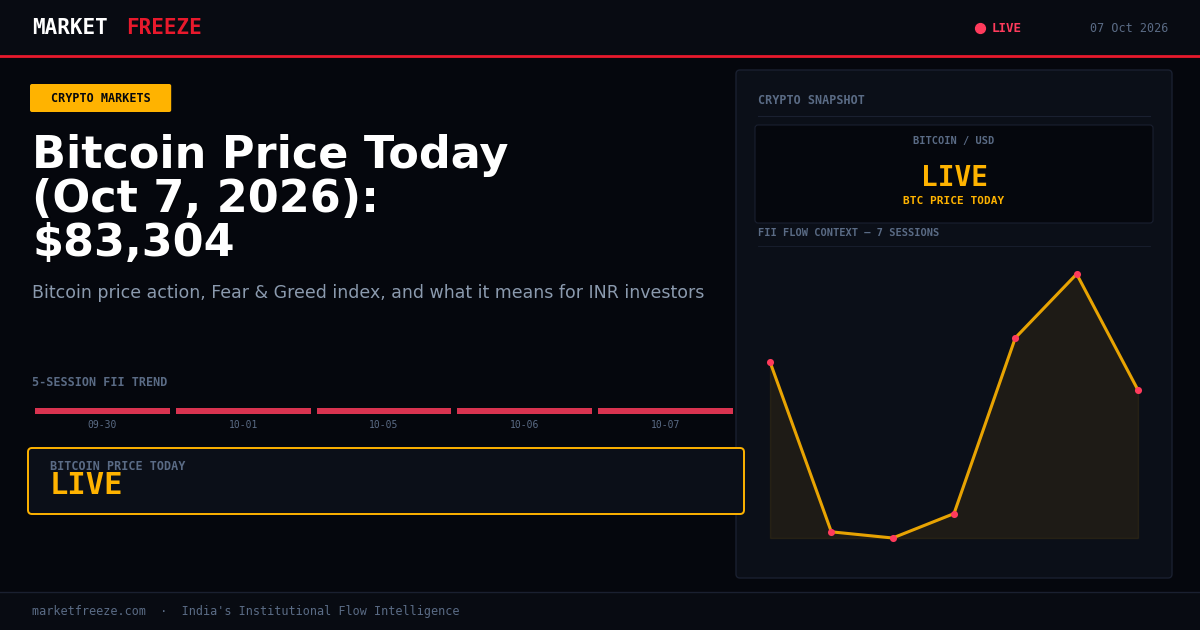
Bitcoin is trading at $83,304 USD or ₹8,036,336 INR, marking a -3.15% change in the last 24 hours, as the digital asset sees a notable pullback amid a prevailing ‘Greed’ sentiment in the market. The broader crypto market is experiencing a downturn, with Ethereum down -5.49% and Solana down -3.49%, mirroring a cautious approach from investors. This price action comes as OKX reportedly raises over $500M, but faces significant liquidations following a late evening selloff, highlighting the sharp reversals that can occur in this asset class.
Open a free demat account with
Upstox
or
Angel One
— zero brokerage on delivery trades.
Bitcoin’s Retreat Amidst Investor Euphoria
Bitcoin’s sharp decline from recent highs, currently at $83,304 USD (₹8,036,336 INR), signals a potential short-term correction. The market is currently displaying a ‘Greed’ reading of 71/100 on the Fear & Greed Index. Historically, readings above 60 have often preceded pullbacks of 5-15% within a 2-4 week timeframe. While the ‘Greed’ phase in the 2020-21 bull cycle saw sustained readings above 75 for months, the current environment warrants close observation of on-chain activity and macroeconomic cues. The news surrounding OKX’s fundraising, juxtaposed with significant liquidations, underscores the rapid shifts in market dynamics and investor positioning. A sustained drop below $80,000 USD (₹7,719,200 INR) could signal further downside, with initial support potentially found around $75,000 USD (₹7,236,800 INR).
USD/INR Dynamics and Impact on Indian Crypto Holdings
The current USD/INR exchange rate stands at ₹96.47. For Indian retail investors holding cryptocurrencies denominated in USD, this exchange rate plays a crucial role in determining their realized INR returns. A strengthening INR (a lower USD/INR rate) would dampen INR returns for the same USD price of crypto, while a weakening INR (a higher USD/INR rate) would amplify those returns. Given the current USD/INR rate, Indian investors are experiencing a direct conversion of their USD-denominated crypto gains or losses into INR. For instance, if an investor bought Bitcoin at $70,000 USD (₹6,757,000 INR at the then prevailing rate) and is now selling at $83,304 USD (₹8,036,336 INR), the INR return is significantly influenced by the stability or movement of the USD/INR pair. A stable ₹96.47 today means the INR gains are primarily driven by Bitcoin’s USD price appreciation. However, any significant fluctuation in USD/INR could either enhance or erode these gains.
Ethereum’s Underperformance and the ETH/BTC Ratio
Ethereum is currently trading at $2,562 USD (₹247,156 INR), down -5.49% in the last 24 hours. This underperformance is also reflected in the ETH/BTC ratio, which stands at 0.0308, indicating that Bitcoin is outperforming Ethereum today. This divergence is particularly notable given recent market commentary suggesting that Bitmine, a significant Ethereum buyer, may be nearing its accumulation target. If Bitmine indeed ceases its token purchases once it reaches 5% of its ETH holdings, this could remove a consistent source of demand for Ethereum, potentially contributing to its relative weakness against Bitcoin. Investors should monitor if this trend continues, as a sustained lower ETH/BTC ratio could signal a rotation of capital away from Ethereum towards Bitcoin or other altcoins perceived as having stronger immediate upside potential. The move in the ETH/BTC ratio is a key indicator for altcoin strategies.
FII Outflows and the Crypto Capital Flow Hypothesis
Today, Foreign Institutional Investors (FIIs) have been net sellers in Indian equities to the tune of ₹6,121.37 Cr. This is part of a broader trend observed over the last five trading sessions, where FIIs have consistently divested from Indian stock markets. In contrast, Domestic Institutional Investors (DIIs) have largely remained net buyers, absorbing some of the selling pressure. The correlation between FII flows and the crypto market is a subject of ongoing analysis. While direct attribution is complex, a common hypothesis suggests that periods of significant FII outflows from traditional markets could lead to a reallocation of capital towards alternative assets like cryptocurrencies, especially during periods of high liquidity or perceived uncorrelated returns. Conversely, when FIIs are aggressively selling equities, it could also signal a broader risk-off sentiment that might spill over into riskier assets like crypto. Today’s ₹6,121.37 Cr FII outflow, while substantial, is being partially offset by DII inflows of ₹4,596.57 Cr, suggesting a complex capital flow dynamic within the Indian market. The Nifty closed at 22603.05 today, down from recent highs, reflecting the impact of these institutional movements.
Navigating the ‘Greed’ Zone: Historical Context and Market Signals
The current Fear & Greed Index reading of 71/100 firmly places the market in the ‘Greed’ territory. As per historical data, such elevated levels often precede short-term corrections, typically ranging from 5% to 15% within a 2-4 week window. While the ‘Greed’ phase experienced during the 2020-2021 bull cycle saw sustained readings above 75 for extended periods, the current market environment might not possess the same underlying strength for prolonged euphoria. Investors should interpret this ‘Greed’ reading as a signal for caution rather than an endorsement of further immediate upside. A gradual cooling off from these levels, accompanied by decreasing trading volumes and increasing volatility, would be typical indicators of an impending correction. Conversely, a sharp drop in the Fear & Greed Index to ‘Neutral’ or ‘Fear’ could signal capitulation and potential buying opportunities.
Solana and the Broader Altcoin Landscape
Solana, currently priced at $116.14 USD (₹11,204 INR), has experienced a -3.49% decline over the past 24 hours, mirroring the broader market downturn. The performance of Solana and other altcoins is often closely tied to Bitcoin’s price action and overall market sentiment. In a corrective phase for Bitcoin, altcoins typically see amplified losses due to their higher beta. The news flow around specific altcoins, such as the potential end of Bitmine’s Ethereum accumulation, can also create sector-specific headwinds. For now, the focus remains on Bitcoin’s ability to hold key support levels. Should Bitcoin stabilize or recover, altcoins like Solana could see a swift rebound, but in the current environment, they remain highly susceptible to broader market sentiment shifts and any further negative news concerning major crypto entities.
Crypto Tax Mechanics: A Hypothetical Scenario
Let’s consider a hypothetical Indian investor who purchased 1 Bitcoin on September 15, 2026, for $75,000 USD (approximately ₹7,200,000 INR based on an assumed USD/INR of ₹96.00 at the time). Today, October 7, 2026, that same Bitcoin is valued at $83,304 USD (₹8,036,336 INR at the current USD/INR of ₹96.47). If this investor were to sell their Bitcoin today, they would realize a profit. The Long Term Capital Gains (LTCG) tax in India on cryptocurrency is 30% plus applicable surcharge and cess. In this scenario, the notional capital gain would be approximately ₹836,336 INR. The tax liability on this gain would be 30% of ₹836,336 INR, which is approximately ₹250,900 INR, before considering any surcharges or cess. This illustration highlights the importance of understanding crypto tax implications for any realized gains from digital asset investments in India.
Key Levels to Watch
Given the current FII selling pressure and the Nifty’s close at 22603.05, the market is displaying signs of caution. The immediate support for the Nifty lies around the 22500 mark. A breach of this level, especially if accompanied by sustained FII outflows, could lead to a test of the 22300 level. On the upside, resistance is observed around the 22750 zone. A decisive move above this resistance, potentially fueled by DII buying or a reversal in FII flows, could propel the index towards 22900. The current trend suggests that 22500 is a critical support level to monitor for the Nifty in the short term.
FAQ Section
Q: What did FII buy or sell on October 5, 2026?
A: FIIs were net sellers of ₹4,699.14 Cr in Indian equities on October 5, 2026.
Q: What did DII buy on October 6, 2026?
A: DIIs were net buyers of ₹5,088.92 Cr in Indian equities on October 6, 2026.
Q: Is FII buying or selling in October 2026?
A: In October 2026, FIIs have shown a consistent selling trend, with net outflows recorded in the sessions observed so far.
Navigating India’s Virtual Digital Asset (VDA) Tax Framework
For Indian investors, understanding the tax implications of cryptocurrency trading is paramount, particularly with the introduction of a flat 30% tax on Virtual Digital Assets (VDAs) and no provision for offsetting losses against other income. This means any profit made from selling crypto, regardless of how long it was held, is taxed at 30%. For example, if an investor makes a total profit of ₹10,00,000 INR across various trades in a financial year, their tax liability would be ₹3,00,000 INR, plus applicable surcharge and cess. Unlike traditional capital gains, crypto losses cannot be carried forward to offset future gains, nor can they be set off against other income sources. This strict taxation regime emphasizes the importance of meticulous record-keeping and strategic tax planning for Indian crypto holders. The calculation of gains or losses is based on the fair market value of the VDA at the time of acquisition and transfer, and the USD/INR exchange rate at these specific moments plays a vital role in determining the INR value of these transactions.
Actionable Framework: Key Levels and Strategic Considerations
Given the current market sentiment and the pullback observed, a structured approach is advisable for navigating the crypto landscape. Here are key levels and strategic considerations:
-
Bitcoin (BTC):
- Immediate Support: Watch for a potential hold around $80,000 USD (₹7,719,200 INR). A sustained break below this could signal further downside towards $75,000 USD (₹7,236,800 INR).
- Resistance: Breaking back above $85,000 USD (₹8,194,400 INR) would be a positive sign, with psychological resistance around $90,000 USD (₹8,670,400 INR).
-
Ethereum (ETH):
- Immediate Support: The $2,500 USD (₹241,120 INR) level is a key psychological and technical support. A drop below could target $2,400 USD (₹231,475 INR).
- Resistance: A reclaim of $2,700 USD (₹260,472 INR) is crucial for any short-term bullish momentum.
-
ETH/BTC Ratio:
- Support: A sustained break below 0.0300 could indicate continued underperformance of ETH against BTC.
- Resistance: A move back above 0.0320 would suggest a potential shift in favor of Ethereum.
Investors should consider implementing dollar-cost averaging (DCA) strategies during these pullbacks, especially if long-term conviction remains high. Monitoring on-chain metrics for significant whale movements or shifts in exchange balances can provide further directional clues.
Bottom Line
Today’s market action sees Bitcoin facing headwinds at $83,304 USD (₹8,036,336 INR) amid prevailing ‘Greed’ on the Fear & Greed Index, suggesting a potential for short-term correction. Ethereum is underperforming Bitcoin, with the ETH/BTC ratio at 0.0308, potentially influenced by large buyer behavior changes. Meanwhile, continued FII outflows from Indian equities, totaling ₹6,121.37 Cr today, underscore a cautious institutional stance. Indian investors must remain aware of how the USD/INR rate of ₹96.47 impacts their INR returns on crypto holdings, especially as tax implications on capital gains remain a critical consideration for any profitable trades.
Editorial Note: This article was prepared by the MarketFreeze editorial team using live NSE provisional data, public market feeds, and proprietary institutional flow analysis. All price and flow figures are sourced directly from NSE, BSE, and CoinGecko as of 07 October 2026. This content is for informational purposes only and does not constitute investment advice. MarketFreeze is not SEBI-registered. Please consult a qualified financial advisor before making investment decisions. Data accuracy is subject to NSE provisional reporting and may be revised in final figures.