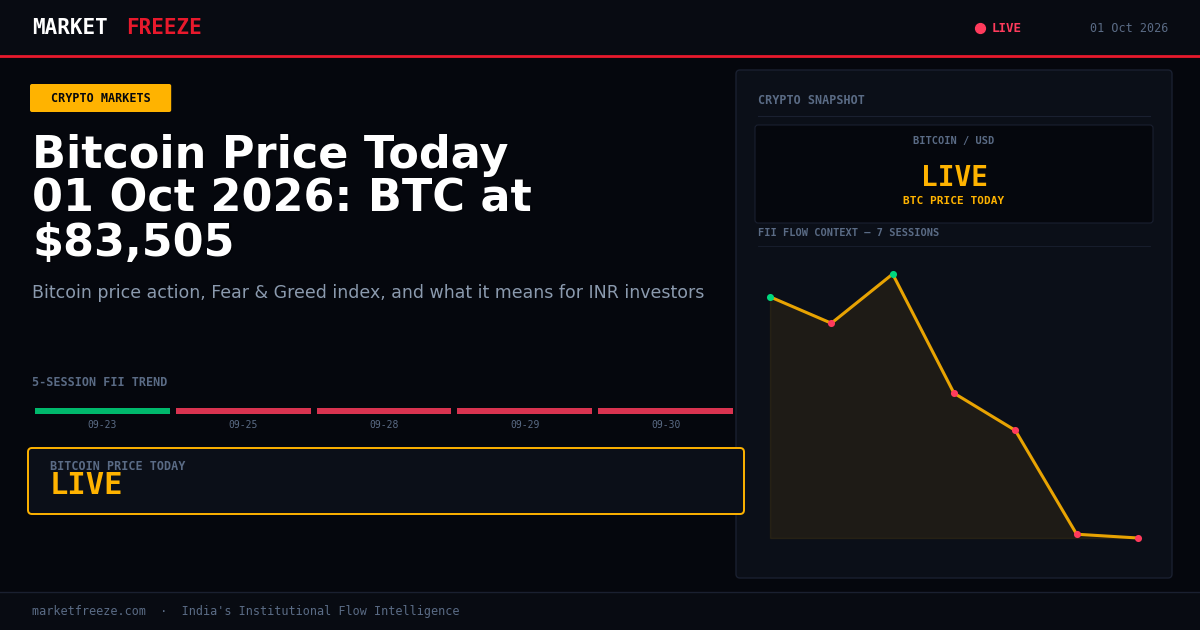
Bitcoin is trading at $83,464 USD (₹8,012,544 INR) today, showing a -2.00% change over the last 24 hours. This price action comes as the crypto market digests news that live updates indicate Bitcoin is flat near $84,000 after closing out its best quarter since 2024, with interest rates dipping ahead of key U.S. employment reports.
Open a free demat account with
Upstox
or
Angel One
— zero brokerage on delivery trades.
Bitcoin’s Stumble Amidst Economic Indicators and Blockchain Security Concerns
Bitcoin’s slight dip to $83,464 USD (₹8,012,544 INR) today, a -2.00% movement, occurs in the shadow of significant macroeconomic events and ongoing industry challenges. The news of Bitcoin closing its best quarter since 2024 provides a backdrop of strength, yet short-term jitters are evident as interest rates show a downward trend in anticipation of crucial U.S. employment data. This careful positioning by traders ahead of economic releases is a standard play, but it amplifies any existing market hesitancy. Compounding this is the broader crypto market’s struggle with hacks, which saw a staggering $1.26 billion lost while Bitcoin bulls celebrated a monster quarter. While today’s price action for Bitcoin isn’t a dramatic sell-off, it reflects a market that is consolidating gains and reassessing risk in light of both on-chain security threats and macro-economic signals. For Indian investors holding Bitcoin, the immediate impact of this price movement is compounded by the prevailing USD/INR rate, which stands at ₹96.0.
Indian Rupee’s Influence on Crypto Returns for Local Investors
The current USD/INR exchange rate of ₹96.0 is a critical factor for Indian retail investors navigating the cryptocurrency markets. As Bitcoin trades at $83,464 USD (₹8,012,544 INR), any fluctuation in the USD/INR pair directly impacts the rupee-denominated returns. For instance, a strengthening rupee (meaning fewer INR are needed to buy one USD) would slightly diminish the INR value of Bitcoin holdings, even if the USD price remained stable. Conversely, a weakening rupee would boost the INR value of these holdings. Today’s flat to slightly negative movement in Bitcoin’s USD price, combined with the steady ₹96.0 USD/INR rate, suggests that Indian investors are experiencing a direct reflection of the USD price movement in their INR holdings, without significant currency translation headwinds or tailwinds at this moment. However, the -2.00% drop in BTC’s USD price translates to a similar percentage decrease in its INR value, assuming the USD/INR remains constant. This highlights the dual nature of crypto investing for Indians – it’s a bet on both the underlying digital asset and the stability or direction of the Indian Rupee against the US Dollar.
Ethereum’s Underperformance and Shifting Altcoin Landscape
Ethereum is currently priced at $2,684 USD (₹257,664 INR), marking a -1.34% decline over the past 24 hours. This performance is notable when compared to Bitcoin’s -2.00% drop. The ETH/BTC ratio stands at 0.0322, indicating that Bitcoin has shown relative resilience compared to Ethereum today. This divergence suggests that while the broader crypto market is experiencing some downward pressure, Bitcoin is holding its ground more effectively than Ethereum. This could be influenced by various factors, including differing market sentiment towards the two largest cryptocurrencies, or specific developments within their respective ecosystems. The Solana network, which has seen significant interest, is down a steeper -4.23% to $117.03 USD (₹11,234 INR). This broader weakness in altcoins like Solana, while Ethereum shows comparative strength against Bitcoin, paints a mixed picture for the altcoin market. Investors are observing whether this trend continues, potentially signalling a rotation back to perceived safer assets within the crypto space, or if it’s a temporary divergence before the altcoin market reasserts its growth potential.
The Shadow of Hacks and Regulatory Scrutiny on Market Psychology
The crypto market is currently grappling with a significant breach, with news highlighting that crypto lost $1.26 billion in hacks while bitcoin bulls enjoyed a monster quarter. This stark contrast underscores a persistent challenge within the industry: the tension between impressive asset appreciation and the ongoing vulnerability to security breaches. Today’s “Greed” reading on the Fear & Greed Index stands at 74/100. Historical context suggests that greed readings above 60 have often preceded short-term corrections of 5-15% within 2-4 weeks. While the market has seen prolonged periods of extreme greed, such as in 2020-21 where readings above 75 persisted for months, the current level, especially in conjunction with major hack incidents, warrants caution. The substantial losses from hacks can erode investor confidence and trigger profit-taking, potentially leading to the very corrections that high greed readings often foreshadow. For Indian investors, this means that even as the market exhibits signs of optimism, the underlying risks associated with security and potential regulatory responses to such breaches remain a significant consideration.
Institutional Flows: A Tale of Two Markets
The divergence in institutional flows between global crypto markets and Indian equities presents a fascinating dichotomy for investors. While specific FII net flow data for crypto is not provided in this report, we can examine the institutional activity in Indian equities. Today, FIIs are net buyers in Indian equities with a figure of ₹0 Cr, which represents a pause after significant selling pressure over the preceding sessions. Looking at the historical data for the last 5 trading sessions:
| Date | FII Net (Cr) | DII Net (Cr) | Nifty Close |
|---|---|---|---|
| 2026-09-23 | +₹1,617.45 Cr | +₹2,341.46 Cr | 23,063.10 |
| 2026-09-25 | ₹-3,693.93 Cr | +₹2,838.17 Cr | 23,140.50 |
| 2026-09-28 | ₹-5,353.22 Cr | +₹5,189.02 Cr | 22,716.20 |
| 2026-09-29 | ₹-9,980.22 Cr | +₹6,952.71 Cr | 22,620.45 |
| 2026-09-30 | ₹-10,148.41 Cr | +₹11,271.73 Cr | 22,421.95 |
The table clearly illustrates a period of significant FII outflows from Indian equities, particularly in the latter half of September, reaching as high as ₹-10,148.41 Cr on September 30th. Concurrently, Domestic Institutional Investors (DIIs) have been consistent net buyers, stepping in to absorb selling pressure and providing support to the Nifty, which closed at 22421.95 today. This trend in Indian equities contrasts with the lack of specific FII flow data for crypto. However, the substantial FII outflows from Indian equities could, in theory, indicate a reallocation of capital towards other asset classes or geographies, a portion of which might include digital assets. Alternatively, it could signal a more cautious global outlook among foreign institutions. The current ₹0 Cr FII net today in equities suggests a temporary pause or a shift towards net neutrality, which bears close observation for its implications on both equity and potentially crypto markets where these institutions may also be active.
Navigating Crypto Taxes: A Practical Illustration
For Indian investors, understanding the tax implications of cryptocurrency transactions is paramount. Let’s consider a scenario involving Bitcoin, currently priced at $83,464 USD (₹8,012,544 INR). If an investor were to sell 0.5 BTC, the transaction value in INR would be approximately ₹4,006,272 INR (0.5 * ₹8,012,544). Under India’s current crypto tax regime, any gains from the sale of virtual digital assets are taxed at a flat rate of 30%, plus applicable surcharges and cess. This means that on the profit made from this sale, the investor would be liable to pay tax. For example, if the cost of acquisition for this 0.5 BTC was ₹3,000,000 INR, the taxable gain would be ₹1,006,272 INR. The tax payable on this gain would be 30% of ₹1,006,272 INR, which amounts to ₹301,881.6 INR, plus any applicable surcharges and cess. It’s crucial to remember that losses from crypto transactions cannot be offset against other income, and only a limited set of intra-asset class losses can be carried forward. Furthermore, a 1% TDS (Tax Deducted at Source) is applicable on the transfer of virtual digital assets, which would be 1% of the transaction value, amounting to ₹40,062.72 INR in this case. This TDS can be claimed as a credit against the total tax liability. Given the complexity and flat tax rate, investors are advised to meticulously track their transactions and consult with tax professionals to ensure compliance and optimize their tax liabilities.
Ethereum and the ETH/BTC Ratio: A Bellwether for Altcoin Strength
The ETH/BTC ratio currently stands at 0.0322, with Ethereum priced at $2,684 USD (₹257,664 INR) and Bitcoin at $83,464 USD (₹8,012,544 INR). Today, Bitcoin has demonstrated greater resilience with a -2.00% decline compared to Ethereum’s -1.34% drop. This means Bitcoin has outperformed Ethereum on a percentage basis over the last 24 hours. The ETH/BTC ratio is a key metric that often acts as a barometer for the overall health and sentiment of the broader altcoin market. Historically, when Ethereum outperforms Bitcoin (meaning the ETH/BTC ratio trends upwards), it often signals a period of strong altcoin performance, as capital flows into Ethereum and then potentially cascades into other altcoins. Conversely, when Bitcoin outperforms Ethereum (the ETH/BTC ratio trends downwards), it can indicate a flight to perceived safety within the crypto market, with investors favouring the market leader over altcoins. Today’s dynamic, where BTC is holding steadier than ETH, suggests a cautious undertone in the market, potentially indicating a preference for the established leader over the second-largest cryptocurrency. While Ethereum’s absolute price decrease is less severe than Bitcoin’s, the fact that BTC is relatively stronger against ETH is a nuanced signal that investors watch closely for broader altcoin market implications. For Indian investors, this ratio’s movement, coupled with the USD/INR rate of ₹96.0, provides a comprehensive view of their crypto asset performance.
Illinois’s Crypto Tax Deferral: A Glimpse at Global Regulatory Approaches
News from Illinois indicates that the state has agreed to a six-month delay of its crypto tax, with the tax effectively postponed until July 1st, pending court approval. This development highlights the evolving landscape of cryptocurrency taxation globally and offers a potential insight into how other jurisdictions might approach similar issues. While this is a U.S. state-specific event, it reflects the ongoing dialogue between crypto industries and regulatory bodies worldwide. In India, the current tax framework levies a 30% tax on virtual digital asset gains and a 1% TDS on transactions. The Illinois situation, where a 0.2% tax is being debated and now delayed, suggests that the implementation and structure of crypto taxes are far from settled globally. For Indian investors, this international regulatory flux is important to monitor. Significant shifts in tax policies in major economies can influence global capital flows and investor sentiment, which in turn can impact asset prices, including those held by Indian investors. The fact that Illinois is delaying its tax to focus on a legal dispute implies that the foundational legal standing of crypto taxation is still being contested. This underlines the importance of staying informed about regulatory developments, both domestically and internationally, as they can have tangible effects on the value and taxation of crypto assets held by Indian investors, even if the immediate impact of the Illinois news on Indian crypto prices is indirect.
Key Levels to Watch in the Indian Equity Market
With the Nifty closing at 22421.95 today, and considering the recent trend of FII outflows followed by a brief pause, key levels to watch become critical for Indian equity investors. The recent selling pressure from FIIs, culminating in ₹-10,148.41 Cr on September 30th, has pushed the index lower. The support level, given this selling pressure, can be considered around the 22000-22200 mark. If the selling pressure from FIIs resumes and intensifies, breaking below this support could lead to further downside. On the resistance side, the immediate hurdle appears to be around the 22500-22600 levels. A sustained move above this resistance, potentially accompanied by renewed FII inflows and stronger DII buying, would signal a potential reversal and a move towards higher targets. Today’s ₹0 Cr FII net flow is a neutral signal, but the preceding heavy outflows mean that any sustained positive FII inflow would be a strong bullish indicator, while a return to significant outflows would confirm bearish sentiment. DIIs have shown robust buying, which has provided a cushion. Their continued support around the 22000 mark will be crucial in preventing a deeper correction.
FAQ Section
- Q: What did FII buy or sell on 2026-09-29? A: FIIs were net sellers on 2026-09-29 with a figure of ₹-9,980.22 Cr.
- Q: What did DII buy on 2026-09-30? A: DIIs were net buyers on 2026-09-30 with a figure of +₹11,271.73 Cr.
- Q: Is FII buying or selling in September 2026? A: FIIs were predominantly net sellers throughout September 2026, with substantial outflows observed particularly in the latter half of the month.
Bottom Line
Bitcoin’s current trading price and the broader crypto market are navigating a complex environment shaped by macroeconomic anticipation and persistent security concerns. While Bitcoin shows relative stability compared to Ethereum and some altcoins like Solana, the elevated “Greed” reading on the Fear & Greed Index, coupled with significant hack losses, suggests potential for short-term corrections. For Indian investors, the USD/INR rate of ₹96.0 remains a key determinant of actual returns, while the tax implications of crypto transactions necessitate careful record-keeping. The institutional flow data in Indian equities, showing recent FII outflows and DII inflows, provides a contrasting picture of institutional behavior across asset classes.
Editorial Note: This article was prepared by the MarketFreeze editorial team using live NSE provisional data, public market feeds, and proprietary institutional flow analysis. All price and flow figures are sourced directly from NSE, BSE, and CoinGecko as of 01 October 2026. This content is for informational purposes only and does not constitute investment advice. MarketFreeze is not SEBI-registered. Please consult a qualified financial advisor before making investment decisions. Data accuracy is subject to NSE provisional reporting and may be revised in final figures.