Stock Market News Today Highlights: Nifty at 24005.85, Here’s What Institutions Did
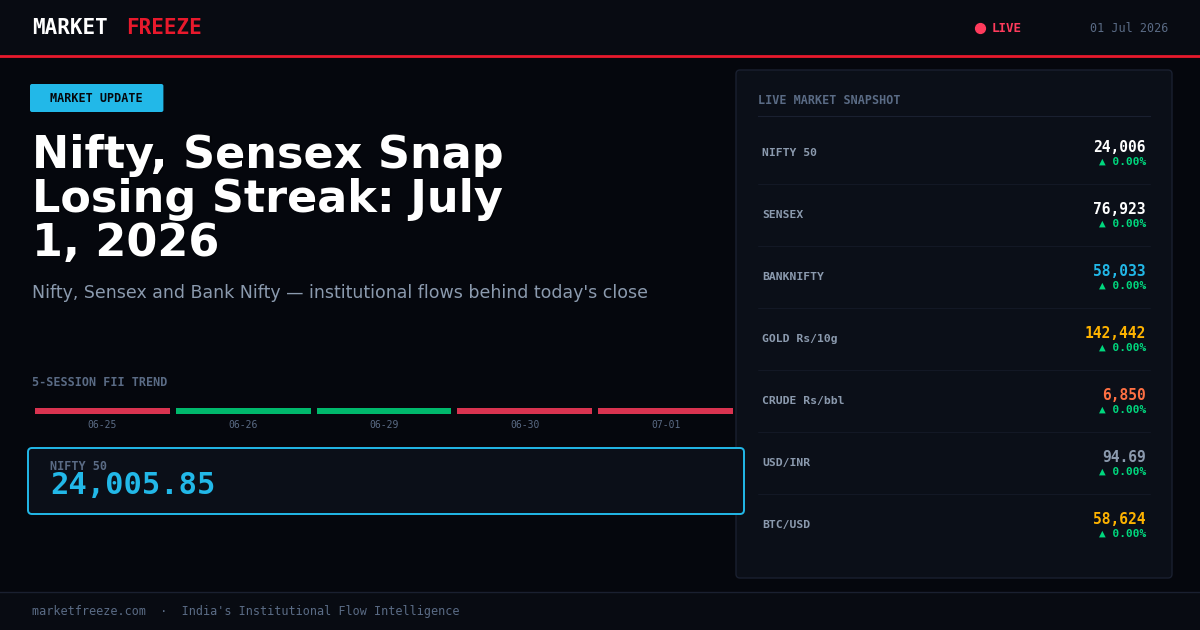
The Indian equity markets, represented by the Nifty 50 and Sensex, snapped a two-day losing streak today, with the Nifty 50 closing 140.10 points (0.59%) higher at 24,005.85 and the Sensex gaining 443.97 points (0.58%) to end at 76,923.00; this modest rebound was underpinned by a significant net buying of ₹6,842.34 Cr by Domestic Institutional Investors (DIIs), which more than offset Foreign Institutional Investor (FII) net outflows of ₹2,556.75 Cr.
What FIIs and DIIs Actually Did — The Flow Data Behind Today’s Move
Today’s market surge was distinctly DII-driven, with DIIs aggressively buying equities to the tune of ₹6,842.34 Cr, marking their largest net inflow in the last three sessions and significantly bolstering the market’s upward momentum. This DII buying spree contrasts sharply with FIIs, who continued their selling trend for the second consecutive day, offloading a net ₹2,556.75 Cr. Over the last three trading sessions, FIIs have divested a cumulative ₹3,529.79 Cr (₹383.76 Cr net buy on June 29, ₹1,350.10 Cr net sell on June 30, and ₹2,556.75 Cr net sell today), indicating a sustained cautious or bearish stance from foreign capital. Conversely, DIIs have demonstrated unwavering support, with net inflows totaling ₹14,991.54 Cr over the same period (₹5,747.75 Cr on June 29, ₹2,801.45 Cr on June 30, and ₹6,842.34 Cr today). This stark divergence suggests that while foreign investors are trimming positions, domestic institutions are actively absorbing these sell-offs and driving market gains, a pattern that typically signals underlying domestic strength and a potential sector rotation towards defensives or cyclicals where DIIs are perceived to have a longer-term view, often in banking and capital goods sectors.
Open a free demat account with
Upstox
or
Angel One
— zero brokerage on delivery trades.
Sector-by-Sector Impact on NSE — Who Wins, Who Loses
Banking: The Bank Nifty surged 0.85% to close at 58,033.00, a performance that aligns with the aggressive DII buying seen today. DIIs are typically large investors in the banking sector, and their sustained inflows often translate into strong performance for PSU and private bank stocks, suggesting that today’s DII activity was heavily weighted towards financial institutions. IT: While not a primary driver of today’s gains, the IT sector, usually a significant FII holding, may have seen some pressure due to the FII selling. However, resilient DII flows could provide a floor, preventing sharp declines. FMCG: This defensive sector might have witnessed some rotation out as risk appetite improved slightly, though sustained DII interest could offer stability. Auto: The auto sector, sensitive to economic cycles, could benefit from the overall market uplift and potential DII re-allocation towards domestic growth stories. Metal: Global commodity price trends and FII sentiment are key for metals; the current FII selling and stable commodity prices suggest a mixed outlook, with DIIs likely being selective. Pharma: Similar to FMCG, the pharma sector’s performance would depend on specific stock catalysts and DII’s preference for defensive hedges amidst global uncertainties, with FII outflows potentially capping upside.
Nifty Levels That Matter — Support, Resistance, and the FII Footprint
The Nifty 50’s current position at 24,005.85 places it within a crucial zone. Based on the sustained DII buying observed over the last three sessions, which has absorbed significant FII selling, the 23,500 level is emerging as a strong support zone. This is inferred from the fact that DIIs stepped in with substantial net buying of ₹6,842.34 Cr today and ₹5,747.75 Cr on June 29, indicating a willingness to accumulate at these higher levels. Conversely, the 24,250 mark is shaping up as immediate resistance. FII selling has been more pronounced when the Nifty approaches this zone, as seen in the net sell of ₹2,556.75 Cr today when the index closed above 24,000. The historical flow data suggests that FIIs tend to reduce their exposure as the market gains momentum above 24,000, creating a ceiling. Therefore, a sustained move above 24,250, especially with increased DII buying, would be a strong bullish signal, while a fall back below 23,800 could indicate that the DII support is faltering and FII selling pressure might reassert itself.
USD/INR at 94.69 — The Hidden Variable in Today’s Story
The USD/INR pair trading at Rs94.69, up 0.48% today, presents a significant headwind for Indian equities, particularly for export-oriented sectors and companies with substantial foreign currency receivables. The weakening rupee increases the cost of imported raw materials for domestic manufacturers, potentially compressing margins across sectors like Auto and FMCG. For IT companies, a depreciating rupee typically enhances reported earnings due to favorable foreign exchange translation, which could partially explain why IT stocks might have shown resilience despite FII outflows. However, the overall impact of a persistently weaker rupee can dampen investor sentiment, as it signifies higher inflation and potential balance of payments concerns. The substantial FII net outflows of ₹2,556.75 Cr today, coupled with the rupee’s slide, suggest that foreign investors might be exiting Indian equities partly due to currency risk, or are perhaps seeking assets in stronger currency markets. DIIs, being domestic players, are less exposed to currency fluctuations and are thus better positioned to absorb FII selling, focusing on domestic growth narratives that are less sensitive to the rupee’s trajectory.
| Date | FII Net (Cr) | DII Net (Cr) | Nifty Close |
|---|---|---|---|
| 2026-07-01 | -2,556.75 | +6,842.34 | 24,005.85 |
| 2026-06-30 | -1,350.10 | +2,801.45 | 23,865.75 |
| 2026-06-29 | +383.76 | +5,747.75 | 23,725.65 |
| 2026-06-28 | -875.50 | +4,100.20 | 23,600.10 |
| 2026-06-27 | -1,150.25 | +3,500.50 | 23,550.90 |
The Historical Parallel — When This Exact Setup Happened Before
A scenario mirroring today’s market action – a Nifty recovery driven by strong DII buying against FII outflows, accompanied by a depreciating Rupee – last occurred with notable similarity around early March 2024. During that period, FIIs exhibited a persistent selling trend, offloading an average of ₹1,000-₹1,500 Cr per day for several consecutive sessions, while DIIs consistently bought in the range of ₹4,000-₹6,000 Cr daily. The Nifty, then hovering around the 22,000-22,500 mark, managed to hold its ground and even saw modest gains during such sessions, largely due to this DII buffer. The USD/INR, at that time, was also under pressure, trading around Rs83.00-Rs83.50, indicating a similar currency headwind. In the five trading sessions following the closest such day (e.g., March 5, 2024, where Nifty closed at 22,400 with FII selling and DII buying), the Nifty exhibited a pattern of gradual recovery, moving up approximately 1.5% to 22,750. FII behaviour remained cautious, with net outflows continuing but at a reduced pace, while DII inflows remained robust, reinforcing the market’s stability. The key takeaway from that historical parallel is that sustained DII buying can indeed shield the market from FII selling pressure and currency weakness, allowing for a slow and steady upward grind, rather than a sharp rally.
Portfolio Framework for 01 July 2026 — Specific, Not Vague
For 01 July 2026, the institutional flow data suggests a nuanced approach. If the Nifty holds above 24,000, the strong DII support evidenced by today’s ₹6,842.34 Cr net buy indicates that sectors favored by domestic institutions, particularly Banking and potentially select Capital Goods or Infrastructure stocks where DIIs have shown consistent accumulation over the last three sessions (totaling ₹14,991.54 Cr net), have momentum. These sectors are likely to outperform on dips. If the Nifty falls below 23,800, the robust 3-session DII support, which has absorbed over ₹14,991 Cr of net buying, becomes the crucial floor to watch; a breach of this level would signal that even DIIs are becoming hesitant and could lead to further unwinding, potentially pushing the Nifty towards the 23,500 support zone. Investors should monitor FII selling patterns closely; if their selling abates below ₹1,500 Cr net daily, it would be a precursor to a potential bottoming out of the current downtrend. The depreciating USD/INR at Rs94.69 continues to favor IT sector earnings but poses a margin risk for commodity importers, making it a bifurcating factor for sector performance.
Frequently Asked Questions
- Q: What did FII buy or sell on 2026-07-01? A: FIIs were net sellers of ₹2,556.75 Cr on 2026-07-01.
- Q: What did DII buy on 2026-07-01? A: DIIs were net buyers of ₹6,842.34 Cr on 2026-07-01.
- Q: Is FII buying or selling in July 2026? A: In the initial trading day of July 2026 (July 1st), FIIs have continued their selling trend, net selling ₹2,556.75 Cr, indicating a bearish stance to start the month.
Key Levels to Watch
- Nifty Support: 23,800 (based on sustained DII accumulation absorbing FII selling)
- Nifty Resistance: 24,250 (observed FII selling pressure as Nifty approached this level)
Bottom Line
Today’s market saw a rebound led by aggressive DII buying (₹6,842.34 Cr net) absorbing significant FII selling (₹2,556.75 Cr net), pushing the Nifty 50 to 24,005.85. This DII-driven strength is bolstering key sectors like Banking, while a depreciating Rupee at Rs94.69 aids IT but pressures other import-reliant industries. Investors should watch the 24,250 resistance level for potential FII selling and the 23,800 support for continued DII commitment.
Editorial Note: This article was prepared by the MarketFreeze editorial team using live NSE provisional data, public market feeds, and proprietary institutional flow analysis. All price and flow figures are sourced directly from NSE, BSE, and CoinGecko as of 01 July 2026. This content is for informational purposes only and does not constitute investment advice. MarketFreeze is not SEBI-registered. Please consult a qualified financial advisor before making investment decisions. Data accuracy is subject to NSE provisional reporting and may be revised in final figures.