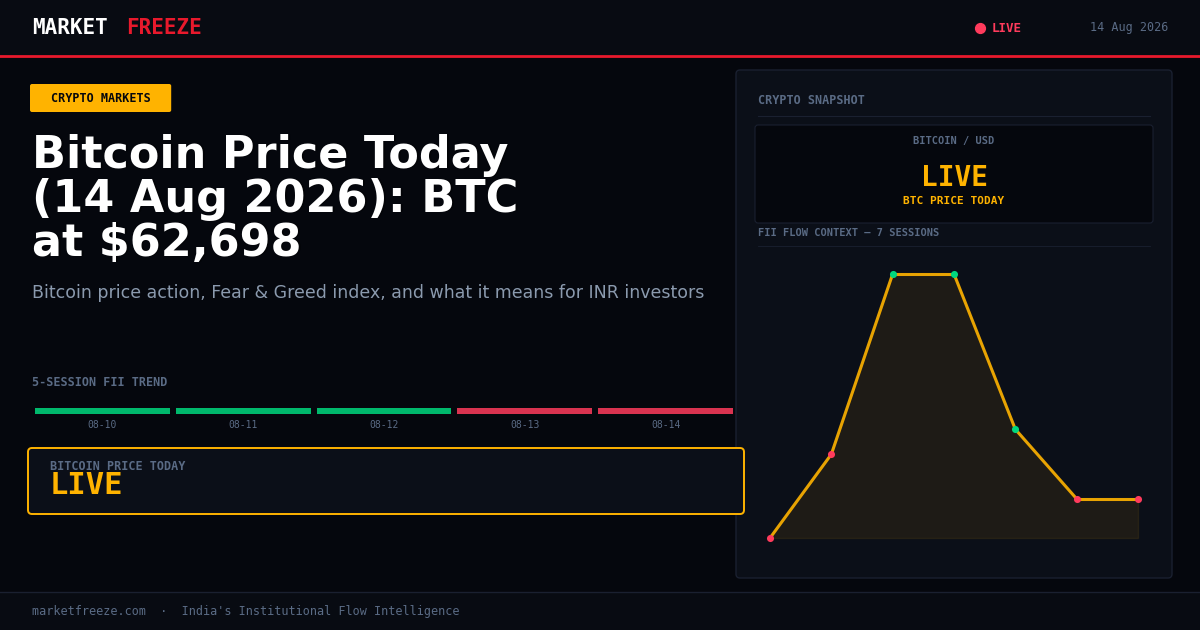
Bitcoin traded at $62,693 USD or ₹5,985,927 INR today, marking a -1.30% change in the last 24 hours. This price action occurs as spot Bitcoin ETFs experienced back-to-back outflows for the first time since late July, a trend highlighted in recent market analysis, suggesting a temporary cooling in institutional digital asset demand.
Open a free demat account with
Upstox
or
Angel One
— zero brokerage on delivery trades.
Bitcoin’s Retreat Amidst ETF Outflows and Broader Market Uncertainty
Bitcoin, the flagship cryptocurrency, has seen a modest pullback today, trading at $62,693 USD (₹5,985,927 INR). This movement aligns with a recent report indicating that spot Bitcoin ETFs have experienced their first consecutive two-day drawdown in outflows since late July. This suggests a temporary pause in the strong institutional inflows that have characterized recent periods. The broader altcoin market is also struggling to find consistent direction, mirroring Bitcoin’s subdued performance. While this is a short-term trend, it’s crucial for Indian investors to monitor these ETF flows as they often act as a leading indicator for digital asset demand from global institutions.
USD/INR Dynamics Impacting Indian Crypto Investor Returns
The Indian Rupee is currently trading at ₹95.48 against the US Dollar. For Indian retail investors holding cryptocurrencies denominated in USD, this exchange rate plays a significant role in their realized returns. A stronger USD/INR (meaning the Rupee is weaker) generally translates into higher INR returns for crypto assets, assuming their USD value remains constant. Conversely, a weaker USD/INR would dampen INR gains. Today, with Bitcoin showing a -1.30% move in USD terms, the INR value of these holdings would also be influenced by the day’s USD/INR movement. Understanding this interplay is vital for accurate profit and loss calculations in the Indian context.
Ethereum’s Performance Relative to Bitcoin and the ETH/BTC Ratio
Ethereum is currently priced at $1,869 USD (₹178,452 INR), showing a -0.88% change over the past 24 hours. The ETH/BTC ratio stands at 0.0298. This ratio indicates that Bitcoin is holding steadier than Ethereum today. While neither asset is experiencing significant positive momentum, Ethereum is underperforming Bitcoin on a relative basis. This divergence, though minor today, is something to watch. Historically, a strong ETH/BTC ratio often signals a broader altcoin bull run or significant Ethereum-specific catalysts. The current trend suggests a preference for Bitcoin’s relative stability over Ethereum’s performance in the immediate term.
Solana and the Broader Altcoin Landscape
Solana is currently trading at $75.34 USD (₹7,193 INR), reflecting a -0.87% change in the last 24 hours. The performance of Solana mirrors the general trend seen across many altcoins today, which are struggling to find direction. This subdued activity in the altcoin market is consistent with the broader cryptocurrency market’s current state, as highlighted by Bitcoin’s slight decline and the ETF outflow data. Investors should note that altcoins often exhibit higher volatility than Bitcoin and Ethereum. Significant shifts in the altcoin market typically follow or amplify broader cryptocurrency trends, making it important to monitor the performance of larger cap assets like Bitcoin and Ethereum for directional cues.
Navigating the “Fear” Zone: Insights from the Fear & Greed Index
The Crypto Fear & Greed Index currently reads 29/100, indicating a state of “Fear” in the market. This reading falls within the historical context of 25-45, which has often marked accumulation zones. Both the March 2020 crash and the Q4 2022 period saw sustained institutional buying commence when the index was in this range. While “Fear” generally suggests investor apprehension and potential selling pressure, for astute investors, it can present opportunities. The current reading suggests that the market is in a phase where potential long-term buying opportunities may be emerging, provided the underlying fundamentals remain sound and broader institutional interest returns.
Institutional Flows: FII’s Cautionary Stance and its Crypto Echo
Today, Foreign Institutional Investors (FIIs) were net sellers in Indian equities, with a net outflow of ₹511 Cr. This cautious approach by FIIs in the traditional Indian stock market, as reflected in the Nifty closing at 24366.0, often correlates with broader risk-off sentiment that can spill over into alternative asset classes like cryptocurrencies. While direct capital flow between FII equity trades and crypto markets is not always explicit, a general reticence from major institutional players in one asset class can signal a more cautious global investment environment. Indian investors should interpret this FII selling as a sign of reduced institutional risk appetite, which might temper immediate upside potential in speculative assets.
Crypto Tax Mechanics: A Hypothetical Scenario with Today’s Bitcoin Price
Let’s consider a hypothetical scenario for an Indian investor. Suppose an investor purchased Bitcoin at $50,000 USD (₹4,775,000 INR) approximately six months ago and decides to sell it today at $62,693 USD (₹5,985,927 INR). This represents a profit of $12,693 USD (₹1,210,927 INR) per Bitcoin. Under India’s current tax laws, such a gain from the sale of virtual digital assets (VDAs) is taxable at a flat rate of 30%, plus applicable surcharges and cess. Therefore, on this hypothetical sale, the tax liability would be approximately ₹363,278 INR (30% of ₹1,210,927 INR). This illustrates the significant tax implications investors must factor into their profit calculations from crypto trading.
Navigating the Current Market: A 3-Step Framework for Indian Investors
Given today’s market conditions – Bitcoin at $62,693 USD (₹5,985,927 INR), a Fear & Greed Index reading of 29, and FII net selling of ₹511 Cr – here is a framework for Indian investors:
- Assess Risk Exposure: With the Fear & Greed Index in the “Fear” zone, it’s a time to review your portfolio’s risk allocation. If your crypto holdings represent an overweight position given current market conditions and your risk tolerance, consider rebalancing.
- Monitor Institutional Signals: Today’s FII net selling of ₹511 Cr in equities suggests a cautious institutional outlook. Observe if this caution extends to other asset classes or if it’s specific to Indian equities. For crypto, watch for sustained ETF outflows or inflows as a key indicator of institutional sentiment.
- Identify Potential Accumulation Points: The Fear & Greed index at 29, coupled with Bitcoin’s current price, could represent an attractive entry point for those with a long-term investment horizon, aligning with historical patterns of institutional buying during “Fear” phases. However, any new investment should be gradual and consider the ongoing ETF outflow trend.
Key Levels to Watch for the Nifty
With the Nifty closing at 24366.0 today and FIIs being net sellers, immediate support levels are critical. The recent downtrend suggests that 24300 could be an initial support zone. A break below this level, especially on increased selling pressure, might lead to a test of the 24200 mark. On the resistance side, the 24450 level, which was recently breached, could act as an immediate hurdle. Significant buying from FIIs or a reversal in their sentiment would be needed to push the Nifty towards the 24550-24600 range.
Frequently Asked Questions
Q: What did FII buy or sell on August 14, 2026?
A: FIIs were net sellers in Indian equities on August 14, 2026, with net outflows of ₹511 Cr.
Q: What did DII buy on August 14, 2026?
A: Domestic Institutional Investors (DIIs) were net buyers in Indian equities on August 14, 2026, with net inflows of ₹4,353.09 Cr.
Q: Is FII buying or selling in August 2026?
A: In the first two weeks of August 2026, FII activity has been mixed, with significant buying in the early part of the month (+₹1,974.76 Cr on Aug 10 & 11) followed by net selling in the latter half of the week (₹-510.69 Cr on Aug 13 & 14). This indicates a fluctuating institutional stance.
The 30% tax on Virtual Digital Assets (VDAs) in India is a critical consideration for all investors. For instance, if an investor bought Bitcoin at $50,000 USD (₹4,775,000 INR) and sold it today at $62,693 USD (₹5,985,927 INR), the profit is $12,693 USD (₹1,210,927 INR). This profit is subject to a flat tax of 30%, amounting to approximately ₹363,278 INR. This tax liability, plus any applicable surcharges and cess, significantly reduces net returns and must be factored into any trading strategy. It’s crucial for investors to maintain meticulous records of all transactions to accurately report gains and losses to tax authorities.
Strategic Levels for Bitcoin and Ethereum Amidst Uncertainty
For Indian investors looking to position themselves, monitoring key technical levels for Bitcoin and Ethereum is essential. Bitcoin’s current price of $62,693 USD (₹5,985,927 INR) shows immediate support around the $62,000 USD (₹5,919,040 INR) mark, a level that has seen buying interest previously. A sustained break below this could target the $60,000 USD (₹5,727,725 INR) psychological level, which coincides with the 50-day moving average. On the upside, resistance is seen near the $64,000 USD (₹6,111,570 INR) to $65,000 USD (₹6,207,270 INR) range, where previous consolidation occurred.
Ethereum, trading at $1,869 USD (₹178,452 INR), faces immediate support at its current trading zone, with a significant psychological level at $1,850 USD (₹176,550 INR). A drop below this could see it testing the $1,750 USD (₹166,950 INR) to $1,700 USD (₹162,150 INR) area, where stronger buying pressure might emerge. Resistance for Ethereum is present around $1,900 USD (₹181,350 INR) and then more firmly at the $2,000 USD (₹191,000 INR) mark.
A Practical Framework for Indian Crypto Investors
Considering the current market dynamics – Bitcoin at $62,693 USD (₹5,985,927 INR), the Fear & Greed Index at 29, and FII outflows of ₹511 Cr – Indian investors can adopt a cautious yet opportunistic approach. Here is a potential three-step framework:
- Review Portfolio Allocation: Given the “Fear” sentiment and potential for further volatility, assess your crypto asset allocation against your risk tolerance. If your portfolio is heavily weighted towards riskier assets or exceeds your comfort level, consider trimming positions or reallocating to more stable assets.
- Dollar-Cost Averaging (DCA) for Long-Term Bets: The “Fear” zone, especially with Bitcoin hovering around the $62,000 USD (₹5,919,040 INR) support, might be suitable for initiating or continuing a DCA strategy. Investing a fixed amount at regular intervals can average out your purchase price and mitigate the risk of buying at a market top, especially if you believe in the long-term potential of these assets.
- Monitor USD/INR and Tax Implications: Always keep the USD/INR exchange rate at ₹95.48 in mind. A depreciating Rupee can cushion USD-denominated crypto losses in INR terms, and vice-versa. Furthermore, factor in the 30% VDA tax on any realized gains when calculating potential profitability and making investment decisions.
Bottom Line
Today’s crypto market, characterized by Bitcoin’s dip below $63,000 USD and increased ETF outflows, suggests a cautious global institutional sentiment. This aligns with FIIs’ net selling in Indian equities, reinforcing a risk-averse environment. While the “Fear” reading on the Fear & Greed Index presents potential long-term accumulation opportunities, Indian investors must navigate the implications of the ₹95.48 USD/INR rate and the taxable nature of crypto gains. Monitoring FII flows and broader institutional movements remains paramount for understanding potential market direction.
Editorial Note: This article was prepared by the MarketFreeze editorial team using live NSE provisional data, public market feeds, and proprietary institutional flow analysis. All price and flow figures are sourced directly from NSE, BSE, and CoinGecko as of 14 August 2026. This content is for informational purposes only and does not constitute investment advice. MarketFreeze is not SEBI-registered. Please consult a qualified financial advisor before making investment decisions. Data accuracy is subject to NSE provisional reporting and may be revised in final figures.