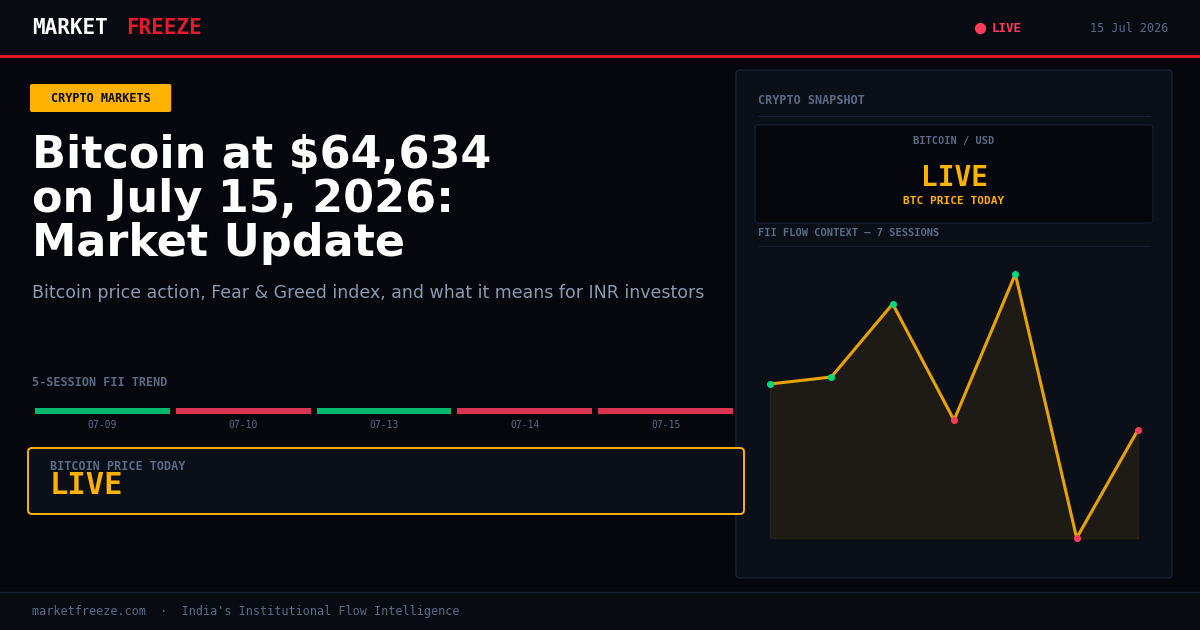
Bitcoin is trading at $64,632 USD, which converts to ₹6,220,183 INR, marking a +3.08% gain in the last 24 hours. The cryptocurrency market is showing signs of stabilization today, as escalating geopolitical tensions in the Middle East are counterbalancing the positive momentum generated by a softer-than-expected US inflation report earlier in the week. This dual influence is keeping Bitcoin anchored at a three-week high, reflecting a complex interplay of macro-economic data and global security concerns. The current price action suggests that while inflation data might offer a short-term boost, broader geopolitical risks are acting as a significant moderating factor on bullish sentiment.
Open a free demat account with
Upstox
or
Angel One
— zero brokerage on delivery trades.
USD/INR Dynamics and Indian Investor Returns
The current USD/INR exchange rate stands at ₹96.24. For Indian investors holding cryptocurrencies denominated in USD, this exchange rate plays a crucial role in determining their actual returns in INR. A strengthening USD against the INR (meaning a higher ₹96.24 figure) would amplify gains made in USD-denominated crypto assets when converted back to rupees. Conversely, it would exacerbate losses. Today, with Bitcoin showing a +3.08% gain in USD terms, the prevailing USD/INR rate means that Indian investors are seeing their INR-denominated crypto portfolios increase by a comparable percentage, assuming they are not actively hedging their currency exposure. The stability or fluctuation of this exchange rate directly impacts the net profitability for a significant portion of the Indian retail investor base in the crypto market, making it a key metric to monitor alongside asset prices themselves.
Ethereum’s Performance and Relative Strength Against Bitcoin
Ethereum is currently priced at $1,879 USD, equivalent to ₹180,834 INR, with a notable +4.67% increase over the past 24 hours. While Ethereum is outperforming Bitcoin in percentage terms today, the ETH/BTC ratio stands at 0.0291. This figure indicates that Bitcoin is still demonstrating stronger relative performance when compared directly to Ethereum. The ETH/BTC ratio is a critical indicator for assessing the relative value proposition of these two leading digital assets. A rising ratio would suggest Ether is gaining ground against Bitcoin, while a falling ratio, as observed today, implies Bitcoin’s momentum is outstripping Ethereum’s. This divergence can be influenced by a multitude of factors, including upcoming network upgrades for Ethereum or specific institutional adoption trends favoring Bitcoin. Today’s ETH/BTC ratio suggests that while Ether is experiencing a healthy price increase, Bitcoin’s upward trajectory is more pronounced on a comparative basis.
The ‘Extreme Fear’ Signal and Historical Crypto Rebound Potential
The Crypto Fear & Greed Index currently reads 25/100, firmly in the “Extreme Fear” territory. This significant dip into extreme fear is a historically potent signal for potential market recoveries. Past data indicates that when the Fear & Greed Index falls below 25, Bitcoin has historically experienced a median recovery of 15-25% over the subsequent 30 days. However, the timing and magnitude of these recoveries can vary considerably. Some instances have seen immediate rebounds, such as in December 2019, while others have experienced delays of several weeks, as observed in June 2022. This current reading of 25 suggests that market participants are exhibiting significant caution and pessimism, which, based on historical patterns, could set the stage for a substantial rebound in the near to medium term. For Indian investors, this presents a potential opportunity, provided they understand the historical context and the inherent risks associated with such periods.
Institutional Flows: Foreign Investors’ Exit and Domestic Buying Support
Today’s market activity saw Foreign Institutional Investors (FIIs) acting as net sellers in Indian equities, with an outflow of ₹739.69 Cr. This comes after a series of mixed flows in the preceding sessions. In contrast, Domestic Institutional Investors (DIIs) continued their buying trend, recording a significant inflow of ₹2,927.71 Cr. The Nifty closed at 24078.50. The persistent selling by FIIs, despite the broader market’s resilience underpinned by DII support, highlights a cautious stance from international investors towards Indian equities. This trend can have a ripple effect on investor sentiment within the domestic market, potentially influencing capital allocation decisions across asset classes, including cryptocurrencies. While a direct, real-time correlation between FII equity flows and crypto asset allocation is complex, sustained FII outflows could indirectly signal a broader risk-off sentiment among global institutions that may also influence their approach to more speculative assets like cryptocurrencies.
Navigating Crypto Tax: A Scenario for Indian Investors
Understanding the tax implications of cryptocurrency transactions is vital for Indian investors. Let’s consider a hypothetical scenario today. Suppose an Indian investor bought 0.5 Bitcoin (BTC) when it was priced at $70,000 USD (approximately ₹6,733,800 INR at a hypothetical USD/INR of ₹96.20) and decides to sell it today when Bitcoin is at $64,632 USD (₹6,220,183 INR). This sale would result in a capital loss. The total sale value in INR would be 0.5 BTC * ₹6,733,800/BTC = ₹3,366,900 INR (using the purchase price for conversion). The purchase value would be 0.5 BTC * ₹6,220,183/BTC = ₹3,110,091.50 INR (using today’s price for conversion). The realized loss in INR would be approximately ₹256,808.50 INR. Under Indian tax laws, capital losses from the sale of cryptocurrencies can be offset against capital gains from other crypto assets, or carried forward for up to eight assessment years to be set off against future capital gains. This example illustrates how even during a price decline, understanding the tax implications is crucial for accurate financial reporting and tax planning.
Actionable Framework: Entering Positions on Extreme Fear
Given the current Extreme Fear reading (25/100) on the Fear & Greed Index, a structured approach to potential entry points for Indian investors can be considered. Based on historical data indicating median recoveries of 15-25% following sub-25 readings, a phased entry strategy could be prudent:
- Phase 1: Initial Accumulation: Upon reaching the 25/100 Fear & Greed level, consider allocating a small portion of your intended investment capital. For instance, if your total planned investment is ₹10,00,000 INR, you might deploy ₹2,00,000 INR now. This would allow you to capitalize on any immediate upward movement.
- Phase 2: Dollar-Cost Averaging (DCA) on Downturns: If the market experiences further dips (e.g., Bitcoin dropping to $62,000 USD or ₹5,966,480 INR), deploy another tranche of capital. For example, invest an additional ₹3,00,000 INR. This DCA approach helps average out your purchase price.
- Phase 3: Strategic Allocation on Recovery Signs: As the Fear & Greed Index begins to move towards neutral (e.g., crossing 30/100) and positive price action persists, consider deploying the remaining capital. For instance, invest the final ₹5,00,000 INR.
- Contingency: Stop-Loss Placement: For any positions entered, consider setting a trailing stop-loss. For example, if an entry is made at $64,632 USD (₹6,220,183 INR), a potential initial stop-loss could be set at 5-7% below the entry point, to protect capital in case the fear sentiment deepens or other negative catalysts emerge.
This framework leverages the extreme fear signal while mitigating risk through phased investment and stop-loss mechanisms, tailored for Indian retail investors. The exact INR amounts and USD prices would need to be monitored closely against the live USD/INR rate.
Key Levels to Watch in Indian Equities
The Nifty closed at 24078.50 today, following a period of mixed FII and strong DII flows. Key support levels for the Nifty, particularly with FIIs currently net sellers, would be around the 23,900 and 23,700 marks. These levels have previously acted as consolidation zones. Resistance is likely to emerge around the 24,200 and 24,350 levels, where the index has recently faced selling pressure. The sustained buying by DIIs provides a cushion, but significant upward moves might be capped until FII flows turn consistently positive or a clear positive catalyst emerges for the broader market.
Frequently Asked Questions
Q: What did FII buy or sell on July 14, 2026?
A: On July 14, 2026, FIIs were net sellers in Indian equities, offloading ₹3,062.27 Cr.
Q: What did DII buy on July 13, 2026?
A: On July 13, 2026, DIIs were net buyers in Indian equities, with inflows totaling ₹2,019.68 Cr.
Q: Is FII buying or selling in July 2026?
A: In July 2026, FII flows have been mixed, with significant selling observed on July 10 and July 14, offset by buying on July 9 and July 13. Today, July 15, FIIs are again net sellers.
Historical FII/DII Flows and Nifty Performance
| Date | FII Net (Cr) | DII Net (Cr) | Nifty Close |
|---|---|---|---|
| 2026-07-09 | +₹1,962.80 Cr | +₹790.16 Cr | 23,962.80 |
| 2026-07-10 | ₹-532.86 Cr | +₹2,057.79 Cr | 24,206.90 |
| 2026-07-13 | +₹2,603.72 Cr | +₹2,019.68 Cr | 24,141.05 |
| 2026-07-14 | ₹-3,062.27 Cr | +₹2,171.70 Cr | 24,086.45 |
| 2026-07-15 | ₹-739.69 Cr | +₹2,927.71 Cr | 24,078.50 |
Bottom Line
Today’s crypto market is navigating a complex landscape, with geopolitical concerns providing a counterpoint to inflation data, keeping Bitcoin at a three-week high of $64,632 USD (₹6,220,183 INR). The prevailing “Extreme Fear” reading of 25/100 on the Fear & Greed Index, historically a precursor to significant recoveries, presents a compelling narrative for potential upside. For Indian investors, the USD/INR rate of ₹96.24 remains a critical factor in translating USD-based crypto gains into INR returns. Meanwhile, Indian equities saw FII outflows of ₹739.69 Cr today, contrasted by robust DII inflows of ₹2,927.71 Cr, with the Nifty closing at 24078.50, indicating underlying domestic buying support amidst foreign caution. The confluence of crypto’s Fear & Greed signal and equity market flows provides a nuanced picture for asset allocation decisions.
Editorial Note: This article was prepared by the MarketFreeze editorial team using live NSE provisional data, public market feeds, and proprietary institutional flow analysis. All price and flow figures are sourced directly from NSE, BSE, and CoinGecko as of 15 July 2026. This content is for informational purposes only and does not constitute investment advice. MarketFreeze is not SEBI-registered. Please consult a qualified financial advisor before making investment decisions. Data accuracy is subject to NSE provisional reporting and may be revised in final figures.