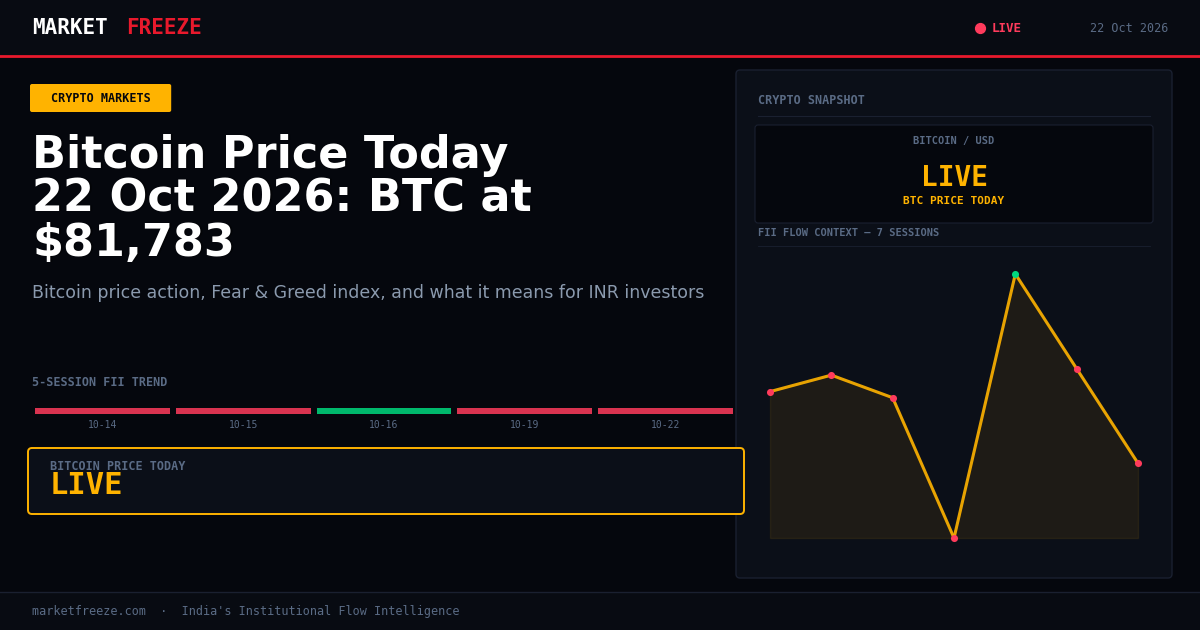
Bitcoin is trading at $81,752 USD (₹7,732,921 INR), marking a -2.29% change in the last 24 hours. This price action comes as crypto traders are seeking shelter in Bitcoin as altcoins slide and ETF flows wobble, according to recent market commentary. The broader crypto market is experiencing a downturn, with Bitcoin seeing a notable price dip below $82,000, coinciding with a broader market sentiment shift away from riskier altcoins.
Open a free demat account with
Upstox
or
Angel One
— zero brokerage on delivery trades.
Bitcoin’s Retreat and the Search for Safety Amidst Altcoin Weakness
Bitcoin, currently at $81,752 USD (₹7,732,921 INR), is showing a -2.29% decline over the past 24 hours. This move is occurring in an environment where crypto traders are reportedly seeking refuge in Bitcoin as altcoins experience significant slides and exchange-traded fund (ETF) flows show volatility. The narrative of Bitcoin acting as a primary safe haven within the digital asset space is being tested as its price also succumbs to broader market pressures. The report highlighting Bitcoin sliding below $82,000 as AI doubts return, with DeFi tokens leading declines, provides further context to this shift. This suggests that even the dominant cryptocurrency is not immune to macroeconomic concerns influencing risk assets. The overall market sentiment appears to be re-evaluating its positions, leading investors to consolidate their holdings in the most established digital asset.
Ethereum’s Transaction Efficiency Push and its Implications for the ETH/BTC Ratio
Ethereum is trading at $2,401 USD (₹227,110 INR), down -3.07% in the last 24 hours. The ETH/BTC ratio stands at 0.0294, indicating that Bitcoin is currently outperforming Ethereum. News that Ethereum’s four-minute settlement plan could lower the cost of moving crypto offers a potential long-term positive for the network’s utility and adoption. If successful, this initiative could reduce the capital tied up in transactions, making Ethereum a more efficient platform for financial services. However, in the immediate short-term, the underperformance of ETH relative to BTC, as reflected in the ETH/BTC ratio, suggests that investors are favoring the perceived safety and resilience of Bitcoin amidst current market uncertainties. This divergence highlights a common pattern where, during periods of heightened risk aversion, capital tends to flow towards Bitcoin, pushing the ETH/BTC ratio lower.
Solana’s Price Action in the Context of Broader Altcoin Weakness
Solana is currently priced at $104.51 USD (₹9,885 INR), reflecting a -2.43% change in the past day. The current market climate, characterized by altcoins sliding and traders seeking shelter in Bitcoin, directly impacts assets like Solana. As a prominent altcoin, Solana is susceptible to the broader risk-off sentiment that is causing investors to reduce exposure to less established digital assets. The DeFi index sliding 6% further underscores the pressure on alternative cryptocurrency sectors. While Solana has its own developmental milestones and ecosystem growth, its price performance is intrinsically linked to the overall appetite for risk in the digital asset markets. Today’s price action for Solana is therefore a direct consequence of the prevailing trend of traders moving away from riskier altcoins towards the perceived safety of Bitcoin.
Indian Rupee’s Influence on Crypto Returns for Domestic Investors
The USD/INR exchange rate is currently at ₹94.59. For Indian retail investors holding cryptocurrencies denominated in USD, fluctuations in the USD/INR rate have a direct impact on their actual INR returns. A strengthening USD against the INR, as indicated by a higher USD/INR quote, means that each dollar earned from crypto investments translates into more rupees. Conversely, a weakening USD would reduce the INR value of dollar-denominated crypto holdings. Given the current USD/INR rate of ₹94.59, Indian investors are seeing their crypto assets’ INR valuation being influenced by this cross-currency dynamic, in addition to the inherent crypto price movements. This adds another layer of complexity to evaluating the true profitability of crypto investments for those based in India.
The “Greed” Indicator and its Historical Warning Signals for the Market
The Crypto Fear & Greed Index stands at 68/100, indicating a state of “Greed.” Historical context provided suggests that greed readings above 60 have often preceded short-term corrections of 5-15% within a 2-4 week timeframe. While periods of sustained greed, such as in the 2020-21 bull cycle where readings stayed above 75 for months, can extend upward trends, the current reading at 68 warrants caution. This level of “Greed” suggests that the market may be overheated and susceptible to a pullback. Investors should note that while optimism is prevalent, the historical pattern points towards a potential short-term recalibration of asset prices. This indicator, when combined with other market signals, can help investors gauge potential entry and exit points.
Foreign Institutional Investor Flows and Their Correlation with Crypto Capital
Today, Foreign Institutional Investors (FIIs) were net sellers in Indian equities to the tune of ₹3,459 Cr. This significant outflow from the Indian equity market raises questions about where capital is being redeployed. While direct correlations are complex, substantial FII selling in equities can sometimes coincide with shifts in global capital allocation, potentially influencing flows into alternative assets like cryptocurrencies. The current “Greed” sentiment in crypto, coupled with FIIs reducing their exposure to Indian stocks, could suggest a reallocation towards perceived safer, or more liquid, global markets, which may or may not include Bitcoin as a hedge or speculative play. The trend of FIIs being net sellers over the last few sessions, as detailed in the table below, highlights a cautious approach towards Indian equities, which might indirectly reflect a broader global capital retrenchment from emerging markets.
Illustrating Crypto Tax Implications with Today’s Bitcoin Price
Let’s consider a hypothetical scenario for Indian investors regarding cryptocurrency taxation. Suppose an investor purchased 0.5 BTC at an average price of $75,000 USD (approximately ₹7,100,000 INR at the time of purchase) and decides to sell it today when Bitcoin is trading at $81,752 USD (₹7,732,921 INR). The profit on this transaction would be approximately $38,760 USD (₹632,921 INR). Under India’s current crypto tax regime, this profit would be subject to a 30% tax rate, plus applicable surcharges and cess. Therefore, the tax liability on this single transaction would be substantial, underscoring the importance of accurate record-keeping and tax planning for cryptocurrency investors in India. This example illustrates the tax implications of capital gains realized from crypto trading based on today’s market prices.
Key Levels to Watch in the Indian Equity Market Amidst FII Outflows
With FIIs continuing their net selling in Indian equities, with today’s figure at ₹3,459 Cr, the Nifty’s immediate trajectory requires careful monitoring. The Nifty closed today at 22687.65. Given the prevailing FII selling pressure, the Nifty’s ability to hold the 22,500 mark will be a critical support level to watch. A breach below this psychological and technical level could invite further selling, potentially pushing the index towards the 22,300 support. On the upside, any sustained buying from domestic institutions (DIIs), who were net buyers today at +₹2,891.32 Cr, could provide a buffer. Resistance is likely to be encountered around the 22,800 to 23,000 levels. The interplay between FII outflows and DII inflows will dictate the near-term direction of the Nifty.
Frequently Asked Questions About Today’s Market Movements
Q: What did FII buy or sell on October 22, 2026?
A: On October 22, 2026, FIIs were net sellers in Indian equities to the tune of ₹3,458.70 Cr.
Q: What did DII buy on October 22, 2026?
A: On October 22, 2026, DIIs were net buyers in Indian equities to the tune of +₹2,891.32 Cr.
Q: Is FII buying or selling in October 2026?
A: In October 2026, FIIs have predominantly been net sellers in Indian equities, with net selling recorded on October 14th (₹-1,857.44 Cr), October 15th (₹-5,285.37 Cr), October 19th (₹-1,148.64 Cr), and October 22nd (₹-3,458.70 Cr). They were net buyers only on October 16th (+₹1,165.92 Cr).
Market Recap and Outlook
| Date | FII Net (Cr) | DII Net (Cr) | Nifty Close |
|---|---|---|---|
| 2026-10-14 | ₹-1,857.44 Cr | +₹2,670.44 Cr | 22,997.35 |
| 2026-10-15 | ₹-5,285.37 Cr | +₹3,319.39 Cr | 23,146.15 |
| 2026-10-16 | +₹1,165.92 Cr | ₹-3,661.28 Cr | 22,888.95 |
| 2026-10-19 | ₹-1,148.64 Cr | +₹3,201.19 Cr | 22,888.95 |
| 2026-10-22 | ₹-3,458.70 Cr | +₹2,891.32 Cr | 22,687.65 |
The Bottom Line
Today’s market action sees Bitcoin trading at $81,752 USD (₹7,732,921 INR) with a -2.29% decline, reflecting a broader shift as crypto traders seek safety in Bitcoin amidst altcoin slides. This sentiment is mirrored by a “Greed” reading of 68/100 on the Fear & Greed Index, historically a precursor to short-term corrections. For Indian investors, the USD/INR rate of ₹94.59 adds another layer to their returns. Furthermore, significant FII outflows of ₹3,459 Cr from Indian equities highlight a cautious institutional stance, which could indirectly influence capital flows in alternative assets. Investors should remain vigilant of these interconnected market dynamics.
The implications of India’s Virtual Digital Asset (VDA) tax regime, specifically the flat 30% tax on gains from virtual digital assets, cannot be overstated for domestic crypto investors. This tax rate applies regardless of the holding period, differentiating it from traditional capital gains taxes. For instance, if an investor acquired a digital asset for ₹10,000 and sold it for ₹15,000, the entire ₹5,000 profit is taxed at 30%, resulting in a tax of ₹1,500. This aggressive taxation can significantly erode profitability, especially for active traders. Furthermore, losses from one VDA cannot be set off against gains from another VDA or any other income, making risk management and tax planning crucial. Today’s Bitcoin price of $81,752 USD (₹7,732,921 INR) means that any gains realized from this price point will be subject to this 30% VDA tax, making the effective return for an Indian investor considerably lower than the headline USD gains.
Navigating the Current Market: A Technical Framework for Bitcoin and Ethereum
Given the current market sentiment and price action, traders and investors should monitor specific technical levels for Bitcoin and Ethereum. For Bitcoin, the immediate support level to watch is the $80,000 USD (₹7,577,480 INR) psychological mark. A sustained break below this could trigger further downside towards the $77,500 USD (₹7,337,160 INR) region. On the upside, resistance is forming around the $83,000 USD (₹7,871,600 INR) to $84,000 USD (₹7,965,880 INR) range. A decisive move above this zone would be necessary to regain bullish momentum.
Ethereum, currently trading at $2,401 USD (₹227,110 INR), faces similar technical considerations. The key support for ETH lies around the $2,350 USD (₹222,380 INR) to $2,300 USD (₹217,650 INR) area. Failure to hold this could see prices revisit the $2,200 USD (₹208,420 INR) level. Resistance for Ethereum is situated between $2,450 USD (₹231,840 INR) and $2,500 USD (₹236,570 INR). A breakthrough here would signal a potential reversal of the current downtrend.
These levels are dynamic and can change rapidly based on news flow, macroeconomic data, and shifts in investor sentiment. The interplay between Bitcoin’s dominance and altcoin performance will continue to be a critical factor in determining the trajectory of these key cryptocurrencies.
Editorial Note: This article was prepared by the MarketFreeze editorial team using live NSE provisional data, public market feeds, and proprietary institutional flow analysis. All price and flow figures are sourced directly from NSE, BSE, and CoinGecko as of 22 October 2026. This content is for informational purposes only and does not constitute investment advice. MarketFreeze is not SEBI-registered. Please consult a qualified financial advisor before making investment decisions. Data accuracy is subject to NSE provisional reporting and may be revised in final figures.