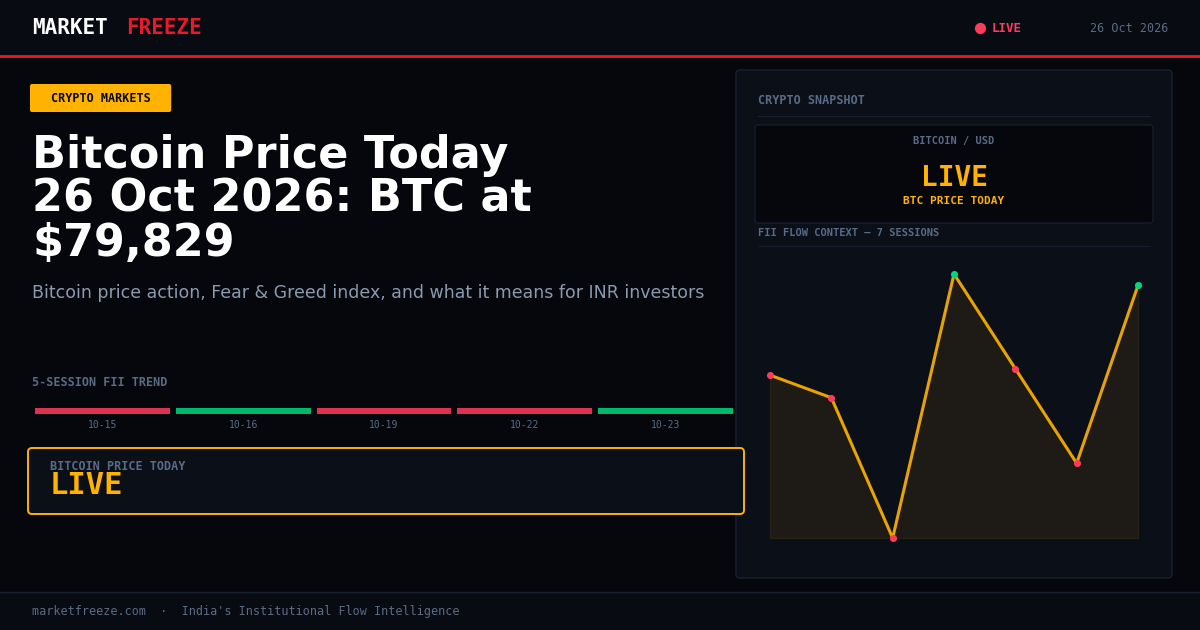
Bitcoin is trading at $79,805 USD, equivalent to ₹7,594,243 INR, marking a -0.50% change over the last 24 hours. This slight pullback comes as analysts point to a sell-off in AI stocks and ETF outflows, with HashKey’s Tim Sun flagging $75,000 as the next key support level.
Open a free demat account with
Upstox
or
Angel One
— zero brokerage on delivery trades.
Bitcoin’s Steady Grip Around $80,000 Amidst Tech Stock Jitters
Bitcoin is holding its ground near the $79,805 USD (₹7,594,243 INR) mark, demonstrating resilience even as the broader tech sector experiences turbulence. The news that Bitcoin is barely holding $80,000 ahead of key economic events, such as the looming Federal Reserve decision and upcoming mid-term elections, underscores the current market dynamics. Analysts are citing a sell-off in AI stocks and outflows from Bitcoin ETFs as contributing factors to the recent pressure. HashKey’s Tim Sun has identified $75,000 USD (₹7,125,000 INR) as a critical support level, a figure that will be closely watched by investors navigating this period of uncertainty. The current 24-hour performance of -0.50% indicates a period of consolidation rather than a sharp decline, suggesting that institutional players are maintaining their positions despite external pressures.
Navigating USD/INR Volatility for Indian Crypto Investors
The prevailing USD/INR rate stands at ₹95.16. For Indian retail investors holding cryptocurrencies, this exchange rate plays a crucial role in determining their actual returns in local currency terms. A strengthening INR (a lower USD/INR rate) would typically dilute the INR value of crypto holdings denominated in USD, while a weakening INR (a higher USD/INR rate) would boost it. Given the current rate, any appreciation in the USD value of digital assets would translate into a proportionally similar appreciation in their INR value. Conversely, a dip in crypto prices would be exacerbated in INR terms if the USD/INR were to fall significantly. Understanding this interplay is vital for managing expectations and optimizing investment strategies in the Indian context.
Ethereum’s Underperformance Against Bitcoin and Broader Market Trends
Ethereum is currently priced at $2,308 USD, which translates to ₹219,629 INR, showing a -0.81% change in the last 24 hours. The ETH/BTC ratio stands at 0.0289, indicating that Bitcoin is outperforming Ethereum today. This divergence suggests that investors are favoring Bitcoin’s perceived stability or its role as a potential hedge in the current environment, especially with ongoing macroeconomic uncertainties. While both major cryptocurrencies are experiencing minor dips, Ethereum’s steeper decline relative to Bitcoin highlights a preference for the larger-cap digital asset. This trend is important to monitor, as shifts in the ETH/BTC ratio can often signal broader sentiment within the altcoin market.
Solana’s Modest Gains Amidst Broader Market Stagnation
In contrast to the slight declines seen in Bitcoin and Ethereum, Solana is showing a positive momentum, trading at $100.99 USD (₹9,610 INR) with a +0.22% change over the past 24 hours. This modest gain positions Solana as a relative outperformer among the top cryptocurrencies today. While the broader crypto market grapples with the implications of tech stock sell-offs and upcoming economic decisions, Solana’s upward movement, albeit small, suggests a degree of independent strength or specific sector-related tailwinds. Investors will be keen to see if this positive trend can be sustained, especially in the context of the overall market’s cautious stance.
Fear & Greed Index at a Neutral Crossroads
The Crypto Fear & Greed Index is currently at 50/100, signaling a neutral sentiment. Historically, neutral readings, typically falling between 45 and 60, have often preceded significant directional moves in the market. This means the index itself becomes less effective as a contrarian indicator during these phases. Investors should not interpret this neutral reading as a signal for complacency or immediate action. Instead, it suggests a market that is neither overly fearful nor excessively greedy, implying a period where underlying fundamentals and external economic factors will likely dictate the next major trend. The lack of strong directional bias from sentiment indicators warrants a closer look at on-chain data and institutional flow patterns.
FII Flows: A Quiet Day for Indian Equities and Crypto Implications
Today’s Foreign Institutional Investor (FII) net flow in Indian equities stands at ₹0 Cr. This represents a significant pause in FII activity, especially when compared to recent sessions. While FIIs were net buyers in Indian equities on October 23rd with +₹887.65 Cr, today’s flat figure suggests a period of observation or rebalancing. The absence of substantial FII inflows or outflows means there is no immediate large-scale capital movement from equities into or out of crypto that can be directly attributed to FII actions today. However, this also means that any significant crypto price action is less likely to be directly influenced by a surge or retreat of foreign institutional capital in the Indian stock market. The market is in a wait-and-watch mode, with FIIs not adding significant pressure or support to either asset class through their equity trading alone.
Key Levels to Watch for Nifty in Light of Institutional Flows
Given the neutral FII flow today (₹0 Cr) and the recent mixed pattern of buying and selling, the Nifty is currently at 22753.2. In the absence of strong directional FII conviction, support for the Nifty will likely be found around the 22600.00 mark, which was the closing level on October 22nd following substantial FII selling (₹-3,458.70 Cr). Resistance will be tested near the highs seen on October 15th, around 23,146.15, a period that also saw significant FII outflows (₹-5,285.37 Cr). The current neutral FII stance suggests that the Nifty may continue to trade within this range, with any breach of these levels requiring a more decisive shift in institutional sentiment or external market drivers.
Crypto Tax Mechanics: A Hypothetical Bitcoin Sale
Let’s consider a hypothetical scenario for Indian investors. If an investor were to sell 0.1 Bitcoin today at the current price of $79,805 USD (₹7,594,243 INR) per BTC, the total sale value would be $7,980.50 USD, or ₹759,424.30 INR. If this Bitcoin was acquired more than 12 months ago, any profit would be subject to a 20% tax plus applicable cess and surcharge, treating it as a long-term capital gain. If acquired within the last 12 months, the profit would be taxed at 30% plus cess and surcharge, as per current Indian crypto tax laws. For instance, if the investor bought this 0.1 BTC for $40,000 USD (₹3,800,000 INR) a year ago, the long-term capital gain would be $39,805 USD (₹3,794,243 INR), leading to a tax liability of approximately ₹758,848.60 INR (20% of gain plus surcharge/cess). This calculation highlights the importance of tracking acquisition costs and holding periods for accurate tax reporting.
FAQ: Your Crypto Queries Answered
Q: What did FII buy or sell on October 22, 2026?
A: On October 22, 2026, FIIs were net sellers in Indian equities, offloading ₹-3,458.70 Cr. DIIs were net buyers, investing +₹2,891.32 Cr.
Q: What did DII buy on October 23, 2026?
A: On October 23, 2026, DIIs were net buyers, investing +₹3,235.36 Cr in Indian equities.
Q: Is FII buying or selling in October 2026?
A: FII activity in October 2026 has shown a mixed trend. After significant selling in the earlier part of the month, there were periods of buying, notably on October 16th (+₹1,165.92 Cr) and October 23rd (+₹887.65 Cr). However, substantial selling also occurred on October 15th (₹-5,285.37 Cr) and October 22nd (₹-3,458.70 Cr). Today’s ₹0 Cr figure indicates a pause in net activity.
| Date | FII Net (Cr) | DII Net (Cr) | Nifty Close |
|---|---|---|---|
| 2026-10-15 | ₹-5,285.37 Cr | +₹3,319.39 Cr | 23,146.15 |
| 2026-10-16 | +₹1,165.92 Cr | ₹-3,661.28 Cr | 22,888.95 |
| 2026-10-19 | ₹-1,148.64 Cr | +₹3,201.19 Cr | 22,888.95 |
| 2026-10-22 | ₹-3,458.70 Cr | +₹2,891.32 Cr | 22,600.00 |
| 2026-10-23 | +₹887.65 Cr | +₹3,235.36 Cr | 22,753.20 |
Actionable Framework: Navigating Bitcoin’s Support and Resistance
Based on today’s data and market commentary, here is a framework for traders:
- Immediate Support (Bullish Scenario): If Bitcoin holds above $79,805 USD (₹7,594,243 INR) and breaks through near-term resistance, the next target could be the psychological level of $80,000 USD (₹7,600,000 INR) and then potentially the highs seen prior to today’s slight dip.
- Key Support Level (Bearish Scenario): A break below today’s price could see Bitcoin test the significant support level identified by analysts at $75,000 USD (₹7,125,000 INR). A sustained move below this level would signal increased bearish pressure, potentially exacerbated by ETF outflows and tech sector weakness.
- FII Flow Confirmation: Monitor FII flows in the coming sessions. A substantial net buying figure from FIIs could provide a tailwind for both equities and potentially cryptocurrencies, while continued selling or stagnation might reinforce the current cautious sentiment.
- USD/INR Watch: Keep an eye on the USD/INR rate. A sharp depreciation of the INR (higher USD/INR) could offer some buffer to crypto losses in INR terms, while INR appreciation would amplify any USD-denominated crypto price declines for Indian investors.
Bottom Line
Bitcoin is consolidating near $79,805 USD (₹7,594,243 INR) amidst broader tech sector jitters and anticipation of key economic events. Ethereum is underperforming Bitcoin, while Solana shows minor gains. The neutral Fear & Greed index suggests a market at a crossroads, with institutional FII flows in Indian equities also showing a pause today. Investors should focus on key price levels and the interplay of the USD/INR exchange rate to manage their portfolios effectively.
Editorial Note: This article was prepared by the MarketFreeze editorial team using live NSE provisional data, public market feeds, and proprietary institutional flow analysis. All price and flow figures are sourced directly from NSE, BSE, and CoinGecko as of 26 October 2026. This content is for informational purposes only and does not constitute investment advice. MarketFreeze is not SEBI-registered. Please consult a qualified financial advisor before making investment decisions. Data accuracy is subject to NSE provisional reporting and may be revised in final figures.