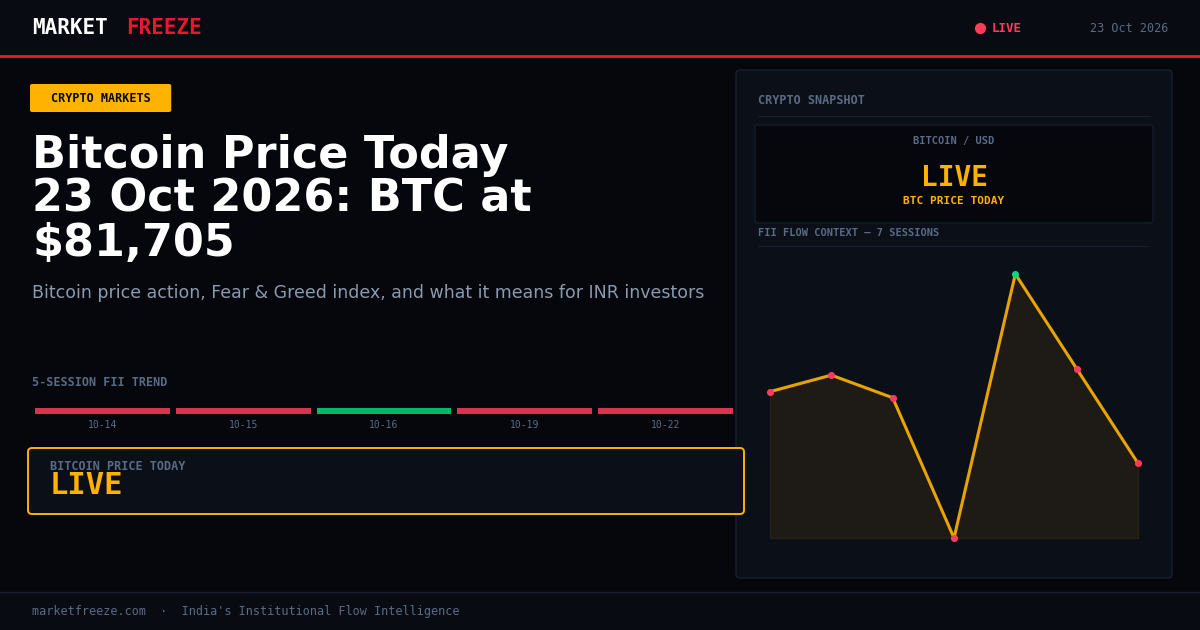
Bitcoin is trading at $81,727 USD, which is ₹7,755,892 INR, down 0.07% in the last 24 hours. This price action aligns with reports suggesting Bitcoin is holding above the $81,000 USD mark as markets show signs of steadying, with Nasdaq 100 futures also appearing stable.
Open a free demat account with
Upstox
or
Angel One
— zero brokerage on delivery trades.
Bitcoin’s Stable Tread Amidst Broader Market Calm
Bitcoin’s current price of $81,727 USD (₹7,755,892 INR) with a marginal -0.07% change over 24 hours indicates a period of relative stability. This steadiness is echoed in global equity futures, with Nasdaq 100 futures showing little movement. This price action is consistent with the narrative that Bitcoin is holding above key psychological levels, such as $81,000 USD, as broader market conditions exhibit a degree of calm. The market’s current “Neutral” Fear & Greed index reading of 50/100 further supports this sentiment of equilibrium, suggesting that extreme fear or euphoria is not currently dictating price movements. This phase of stability in Bitcoin, coupled with the flat overnight performance of indices like South Korea’s Kospi, suggests that the speculative fervor often associated with high-growth tech and crypto assets might be subsiding, allowing for a more measured price discovery process.
Impact of USD/INR on Indian Crypto Investors’ Returns
The current USD/INR exchange rate stands at ₹94.9. For Indian investors holding Bitcoin, this exchange rate is a critical factor in determining their actual returns in INR terms. If an investor purchased Bitcoin when the USD/INR was higher, any depreciation in the INR against the USD (meaning USD/INR increases) would result in a higher INR value for their holdings, even if the Bitcoin price in USD remained constant. Conversely, an appreciation in the INR (USD/INR decreases) would reduce the INR value of their Bitcoin holdings. Today, with Bitcoin showing a slight -0.07% dip in USD terms, the stable ₹94.9 USD/INR rate means that the INR return is largely mirroring the USD performance. For example, if an investor bought 1 BTC at $80,000 USD when USD/INR was ₹90, their initial investment was ₹7,200,000. If they were to sell today at $81,727 USD, with USD/INR at ₹94.9, they would receive ₹7,755,892 INR, representing a significant INR gain even with a modest USD gain. However, if the USD/INR were to fall to ₹90, the same $81,727 would translate to only ₹7,355,430 INR, highlighting the substantial impact of currency fluctuations on profitability for Indian crypto investors.
Ethereum’s Stagnation and the ETH/BTC Ratio
Ethereum is currently priced at $2,403 USD (₹228,044 INR), showing virtually no change with a +0.00% movement in the last 24 hours. The ETH/BTC ratio stands at 0.0294. This ratio indicates that Bitcoin is holding its value more steadfastly than Ethereum today. While both major cryptocurrencies are exhibiting minimal price action, the fact that Bitcoin is not declining while Ethereum is flat suggests a slight underperformance in ETH relative to BTC. This divergence, though small, is notable. Historically, shifts in the ETH/BTC ratio can signal broader trends in the altcoin market, with a rising ratio often correlating with altcoin strength and a falling ratio with Bitcoin dominance. Today’s ratio, however, does not present a strong directional signal, reflecting the overall subdued trading environment for major digital assets.
Altcoin Performance: A Glimpse Beyond Bitcoin and Ethereum
Solana, a prominent altcoin, is trading at $104.34 USD (₹9,901 INR), marking a -0.18% decline over the past 24 hours. This minor dip in Solana is in line with the general trend of slight weakness observed in altcoins when compared to Bitcoin’s relative steadiness. While the provided news snippets do not highlight any specific altcoin rallies or significant downturns beyond Bitcoin and Solana, the general market context of cautious stability suggests that altcoins are likely mirroring the broader, low-volatility environment. The -0.18% movement in Solana is not substantial enough to indicate a major shift in altcoin fortunes, but it does reinforce the observation that Bitcoin is currently the more resilient asset amongst the top cryptocurrencies. Without specific news driving significant individual altcoin movements, the sector is likely to remain influenced by the overarching sentiment surrounding Bitcoin and Ethereum.
Market Psychology: Navigating the Neutral Fear & Greed Zone
The Fear & Greed index currently sits at a “Neutral” reading of 50/100. Historically, as per the provided context, neutral readings (ranging from 45-60) often precede significant directional moves in the market, either upwards or downwards. This means that the current neutral sentiment is not a signal for complacency but rather a potential precursor to increased volatility. When the market is neither overly fearful nor excessively greedy, it suggests a state of indecision among investors, where underlying forces are building up for a potential breakout. For Indian retail investors, this “Neutral” phase in the Fear & Greed index underscores the importance of monitoring key support and resistance levels, as well as institutional flow data, to anticipate the next significant market movement. It implies that current price levels might be a temporary equilibrium before a more decisive trend emerges.
The FII-to-Crypto Capital Flow Thesis: Today’s Numbers
Today’s Foreign Institutional Investor (FII) net flow in Indian equities is ₹0 Cr. This figure signifies a pause in FII activity after several sessions of net selling. The historical data shows a mixed pattern in FII flows over the last five trading sessions, with significant net selling on October 14th (₹-1,857.44 Cr), October 15th (₹-5,285.37 Cr), and October 22nd (₹-3,458.70 Cr), interspersed with a day of net buying on October 16th (+₹1,165.92 Cr). The absence of any net FII flow today, following a substantial outflow on the previous trading day (October 22nd), suggests a period of observation rather than active capital deployment or withdrawal from the Indian equity market. While this data pertains to equity markets, it is crucial for understanding the broader risk sentiment of foreign institutions. A sustained period of FII net outflows from equities could, in theory, correlate with a cautious stance towards risk assets globally, potentially influencing capital allocation away from speculative assets like cryptocurrencies. Conversely, any return of significant FII inflows into equities might signal an improved risk appetite that could spill over into crypto markets.
Open a free demat account with
Upstox
or
Angel One
— zero brokerage on delivery trades.
Crypto Tax Mechanics: A Hypothetical Scenario
Let’s consider a hypothetical scenario for an Indian investor selling Bitcoin today. Suppose an investor decided to sell 0.5 BTC, currently valued at $81,727 USD (₹7,755,892 INR) per BTC. This would mean selling 0.5 BTC for approximately $40,863.5 USD (₹3,877,946 INR). If this sale is considered a taxable event under Indian crypto tax laws, the profit or loss would be calculated based on the acquisition cost. For instance, if the investor acquired this 0.5 BTC at a total cost of $30,000 USD (₹2,700,000 INR) when the USD/INR was ₹90, the profit on this sale would be $10,863.5 USD (₹1,177,946 INR). This profit would then be subject to the applicable capital gains tax rate in India. It’s crucial for investors to maintain detailed records of all transactions, including purchase dates, prices, and corresponding USD/INR rates, to accurately calculate tax liabilities on their crypto holdings.
Key Levels to Watch for Nifty and Crypto
Given the current Nifty level of 22600.0 and the preceding session’s close at the same mark, with substantial FII selling of ₹-3,458.70 Cr on October 22nd, the immediate support for the Nifty is likely to be around the 22500-22550 range. Resistance could emerge around the 22700-22750 levels, especially if FII flows remain subdued or turn negative. In the crypto market, Bitcoin’s stability above $81,000 USD (₹7,710,000 INR) acts as immediate support, while a break below this could target the $79,000 USD (₹7,511,000 INR) mark. Upside resistance for Bitcoin would be the recent highs, likely around $83,000 USD (₹7,900,000 INR). The neutral Fear & Greed index suggests that a decisive move in either direction for both Nifty and Bitcoin could be imminent, making these levels critical for tactical trading decisions.
FII/DII Flow Data: Last 5 Trading Sessions
| Date | FII Net (Cr) | DII Net (Cr) | Nifty Close |
|---|---|---|---|
| 2026-10-14 | ₹-1,857.44 Cr | +₹2,670.44 Cr | 22,997.35 |
| 2026-10-15 | ₹-5,285.37 Cr | +₹3,319.39 Cr | 23,146.15 |
| 2026-10-16 | +₹1,165.92 Cr | ₹-3,661.28 Cr | 22,888.95 |
| 2026-10-19 | ₹-1,148.64 Cr | +₹3,201.19 Cr | 22,888.95 |
| 2026-10-22 | ₹-3,458.70 Cr | +₹2,891.32 Cr | 22,600.00 |
Frequently Asked Questions
Q: What did FII buy or sell on October 22, 2026?
A: FIIs were net sellers of ₹-3,458.70 Cr on October 22, 2026.
Q: What did DII buy on October 16, 2026?
A: DIIs were net sellers of ₹-3,661.28 Cr on October 16, 2026.
Q: Is FII buying or selling in October 2026?
A: In October 2026, FIIs have shown a predominantly selling trend, with net outflows recorded on most trading days, except for a brief period of net buying on October 16th.
Bottom Line
Bitcoin is holding steady at $81,727 USD (₹7,755,892 INR), reflecting a global market that is neither overly fearful nor greedy. The USD/INR rate of ₹94.9 remains a crucial factor for Indian investors’ INR returns. While FIIs took a break from net selling in equities today, their overall trend this month has been cautious. Indian retail investors should remain vigilant of the neutral Fear & Greed index reading, which historically precedes market shifts, and monitor key support and resistance levels in both Nifty and cryptocurrencies.
Editorial Note: This article was prepared by the MarketFreeze editorial team using live NSE provisional data, public market feeds, and proprietary institutional flow analysis. All price and flow figures are sourced directly from NSE, BSE, and CoinGecko as of 23 October 2026. This content is for informational purposes only and does not constitute investment advice. MarketFreeze is not SEBI-registered. Please consult a qualified financial advisor before making investment decisions. Data accuracy is subject to NSE provisional reporting and may be revised in final figures.