Bitcoin is trading at $64,015 USD | ₹5,986,042 INR, marking a -1.61% decline over the last 24 hours. This move comes as Bitcoin miners like MARA are actively seeking substantial debt financing, with MARA raising $185 million after a significant $1 billion BTC sale to manage existing loans. The miner’s strategic shift towards AI infrastructure, leveraging an Ohio power plant, underscores a broader trend of diversification within the crypto mining sector, attempting to find new revenue streams beyond just transaction fees, a move that could signal future capital allocation shifts impacting on-chain supply dynamics.
Open a free demat account with
Upstox
or
Angel One
— zero brokerage on delivery trades.
Indian Equities See Continued FII Inflows Amidst Crypto Downturn
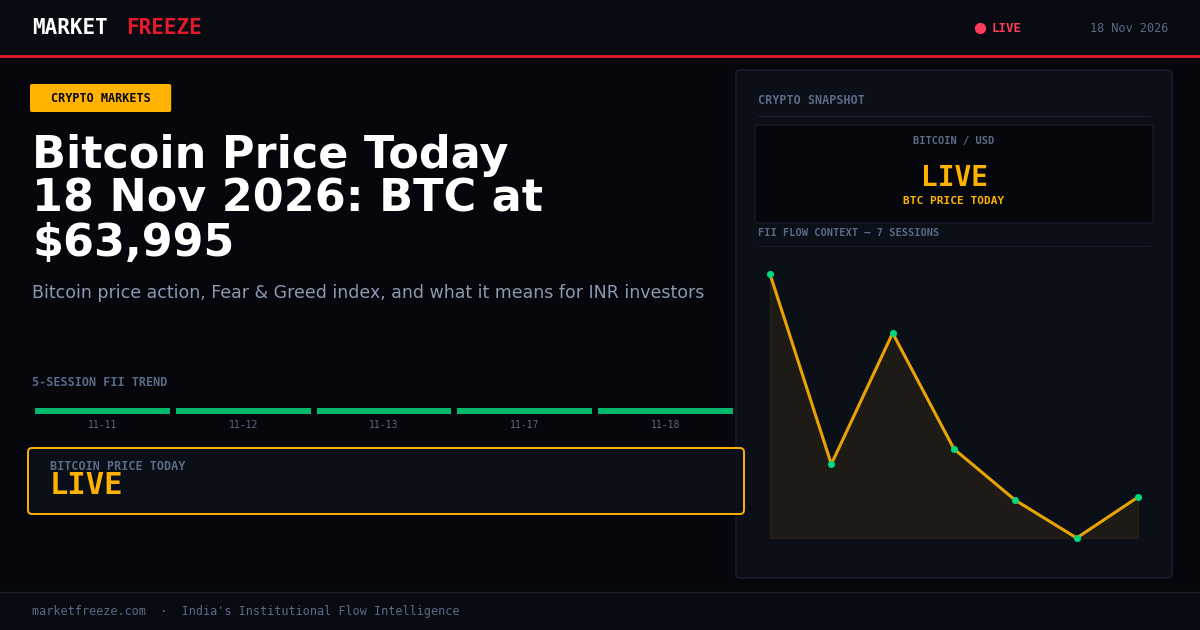
Despite a general dip in major cryptocurrencies like Bitcoin and Ethereum, Indian equities are experiencing a robust influx of foreign institutional investment. Today, Foreign Institutional Investors (FIIs) were net buyers to the tune of ₹5,866.78 Cr, while Domestic Institutional Investors (DIIs) saw a net outflow of ₹3,159.90 Cr. The Nifty closed at 25227.95. This divergence suggests that global capital is finding Indian equity markets attractive, potentially viewing them as a more stable or higher-return asset class compared to the current crypto landscape. The sustained FII buying, as evidenced over the past five sessions, provides a degree of support for the Indian market, even as riskier assets like crypto face headwinds.
USD/INR Dynamics and Their Impact on Crypto Returns for Indian Investors
The Indian Rupee (USD/INR) is currently trading at ₹93.51. For Indian retail investors holding cryptocurrencies denominated in USD, the weakening of the Rupee against the Dollar has a direct impact on their realized INR returns. A higher USD/INR rate amplifies the INR value of USD-denominated crypto holdings, potentially buffering some of the price declines seen in dollar terms. For instance, if an investor bought Bitcoin at a lower USD/INR rate and is now seeing the BTC price fall, the elevated USD/INR rate can partially offset those losses when converting back to Rupees. Conversely, a strengthening Rupee would exacerbate any USD-denominated losses.
Ethereum Struggles as ETH/BTC Ratio Signals Bitcoin’s Relative Strength
Ethereum is currently priced at $1,795 USD | ₹167,850 INR, experiencing a -1.68% change in the last 24 hours. The ETH/BTC ratio stands at 0.028, indicating that Bitcoin is outperforming Ethereum today. This slight underperformance by ETH in relation to BTC suggests a rotation of capital or a preference for the perceived safety of Bitcoin within the cryptocurrency market. While both majors are down, Bitcoin’s resilience relative to Ethereum is a key metric to watch for broader market sentiment within the digital asset space.
Solana’s Upward Momentum Contrasts Broader Crypto Weakness
In contrast to the general decline in Bitcoin and Ethereum, Solana has shown a positive trend, trading at $74.18 USD | ₹6,936 INR, up +0.41% in the last 24 hours. This divergence highlights that not all cryptocurrencies are moving in lockstep, and specific narratives or developments within individual altcoin ecosystems can drive independent price action. While the broader market is subdued, Solana’s ability to gain ground suggests underlying strength or speculative interest in its ecosystem, potentially linked to advancements in its network or developer activity.
Extreme Fear Grips Crypto Markets; Historical Data Suggests Potential for Recovery
The Crypto Fear & Greed Index is currently at an alarming 11/100, firmly in the “Extreme Fear” territory. Historically, readings below 25 have often preceded significant recoveries in Bitcoin. The provided context indicates a median recovery of 15-25% over the subsequent 30 days when the index dips this low, though the timing of these recoveries can vary. Such low sentiment readings, while uncomfortable for current holders, can represent a contrarian signal for those looking to enter the market or accumulate assets at potentially discounted valuations. The delayed nature of some past recoveries underscores the need for patience and a long-term perspective.
FII Capital Allocation: A Potential Indicator for Crypto Flows?
The consistent net buying by FIIs in Indian equities, totaling ₹5,866.78 Cr today and averaging significant inflows over the past five sessions, presents an interesting dynamic when juxtaposed with crypto market movements. While direct correlation is complex, sustained institutional capital entering traditional markets can sometimes signal a broader risk appetite that might eventually spill over into alternative assets like cryptocurrencies. However, the current “Extreme Fear” in crypto suggests that institutional capital may be bifurcating its focus, prioritizing perceived stability in equities over the speculative nature of digital assets at this juncture. The data shows a clear trend of FIIs favoring Indian equities, which could imply a temporary diversion of capital that might otherwise have found its way into riskier assets.
| Date | FII Net (Cr) | DII Net (Cr) | Nifty Close |
|---|---|---|---|
| 2026-11-11 | +₹12,563.33 Cr | ₹-8,434.53 Cr | 25,255.05 |
| 2026-11-12 | +₹7,830.60 Cr | ₹-6,331.17 Cr | 25,144.30 |
| 2026-11-13 | +₹5,736.55 Cr | ₹-2,253.58 Cr | 25,144.30 |
| 2026-11-17 | +₹4,195.38 Cr | +₹196.93 Cr | 25,387.40 |
| 2026-11-18 | +₹5,866.78 Cr | ₹-3,159.90 Cr | 25,227.95 |
Navigating Crypto Tax Implications in a Declining Market
For an Indian investor who purchased Bitcoin at approximately $65,000 USD | ₹6,075,000 INR and today’s price is $64,015 USD | ₹5,986,042 INR, selling would result in a capital loss. This loss, on a crypto asset classified as a virtual digital asset (VDA), would be calculated as the difference between the sale price and the purchase price. In this scenario, the loss would be $985 USD | ₹89,000 INR. Such capital losses from VDA transactions can, under current Indian tax laws, be offset against capital gains from other VDAs, but not against other income sources or capital gains from traditional assets like stocks or property. Careful record-keeping of purchase and sale dates, along with amounts, is crucial for accurate tax reporting.
Key Levels to Watch in the Indian Market
Given the net buying trend from FIIs and the current Nifty close at 25227.95, key support for the Nifty is observed around the 25000 psychological level, which has historically acted as a strong base during periods of volatility. Resistance can be initially seen near the 25300-25400 range, representing recent highs. Sustained FII inflows above ₹5,000 Cr daily would be a strong indicator for upward momentum, potentially pushing the Nifty towards new all-time highs. Conversely, a significant drop in FII purchases or a shift to net selling could signal a correction, with a break below 25000 potentially opening the door to 24800.
Frequently Asked Questions
Q: What did FII buy or sell on November 18, 2026?
A: On November 18, 2026, FIIs were net buyers in Indian equities, with net purchases amounting to ₹5,866.78 Cr.
Q: What did DII buy on November 18, 2026?
A: On November 18, 2026, DIIs were net sellers in Indian equities, with net sales amounting to ₹3,159.90 Cr.
Q: Is FII buying or selling in November 2026?
A: In November 2026, FIIs have shown a consistent trend of net buying in Indian equities. While daily figures fluctuate, the overall pattern for the month, as seen in the last five trading sessions, indicates sustained institutional interest in the Indian market.
The current tax regime for Virtual Digital Assets (VDAs) in India, which mandates a flat 30% tax on all gains, presents a unique challenge during market downturns. Even if an investor incurred a loss on a specific VDA, as illustrated by the Bitcoin example, this loss cannot be utilized to reduce their tax liability on other income sources. This contrasts with traditional capital assets where capital losses can be carried forward and set off against future capital gains. For investors dealing with multiple VDA transactions, especially in a volatile market, this inflexibility can lead to a higher effective tax burden than anticipated. The lack of provision to offset VDA losses against other income streams, or even carry them forward for more than a stipulated period if not set off against VDA gains within the same financial year, necessitates careful tax planning and a deep understanding of the VDA tax rules. This is especially pertinent when considering the potential for significant price swings in assets like Bitcoin and Ethereum.
Strategic Accumulation Levels for Bitcoin and Ethereum
Given the prevailing extreme fear and the potential for significant recovery, as historically observed when the Fear & Greed Index dips below 25, strategic accumulation levels for Bitcoin and Ethereum become paramount. Based on current market conditions and historical patterns, the following could be considered:
- Bitcoin (BTC):
- Accumulation Zone 1: $60,000 – $62,000 USD | ₹5,590,000 – ₹5,780,000 INR. This range represents a critical psychological support and a level where significant buying interest has historically emerged. A dip into this zone could offer a favorable entry point for long-term accumulation.
- Accumulation Zone 2: $55,000 – $58,000 USD | ₹5,130,000 – ₹5,400,000 INR. Should the market experience further downside, this zone would represent a deeper discount and a potentially more aggressive accumulation opportunity, especially if broader market conditions remain bearish.
- Key Resistance: $68,000 – $70,000 USD | ₹6,340,000 – ₹6,530,000 INR. Breaking and holding above this resistance would signal a potential shift in sentiment and the beginning of a recovery phase.
- Ethereum (ETH):
- Accumulation Zone 1: $1,700 – $1,750 USD | ₹158,000 – ₹163,000 INR. Similar to Bitcoin, this range offers a psychological support level and a potential entry point for a first tranche of accumulation.
- Accumulation Zone 2: $1,500 – $1,600 USD | ₹140,000 – ₹149,000 INR. A drop into this deeper zone could present a compelling value proposition for accumulating ETH at significantly reduced prices.
- Key Resistance: $1,900 – $2,000 USD | ₹177,000 – ₹186,000 INR. Sustained movement above this resistance level would indicate a potential reversal and an upward trend resumption.
It is crucial to remember that these are potential accumulation zones and not financial advice. The dynamic nature of the crypto market necessitates continuous monitoring and a well-defined risk management strategy. The ETH/BTC ratio currently favoring Bitcoin (0.028) suggests that while both may recover, Bitcoin might lead the initial leg of any significant upward movement.
Bottom Line
The crypto market is experiencing a period of significant fear, with Bitcoin trading at $64,015 USD | ₹5,986,042 INR and the Fear & Greed Index at 11/100. However, Indian equities remain a bright spot, attracting substantial FII inflows totaling ₹5,866.78 Cr today, even as the Nifty closed at 25227.95. Investors should monitor the USD/INR rate for its impact on their crypto returns and consider historical data suggesting potential crypto recoveries from extreme fear. While Solana shows pockets of strength, the overall sentiment favors traditional assets for now.
Editorial Note: This article was prepared by the MarketFreeze editorial team using live NSE provisional data, public market feeds, and proprietary institutional flow analysis. All price and flow figures are sourced directly from NSE, BSE, and CoinGecko as of 18 November 2026. This content is for informational purposes only and does not constitute investment advice. MarketFreeze is not SEBI-registered. Please consult a qualified financial advisor before making investment decisions. Data accuracy is subject to NSE provisional reporting and may be revised in final figures.