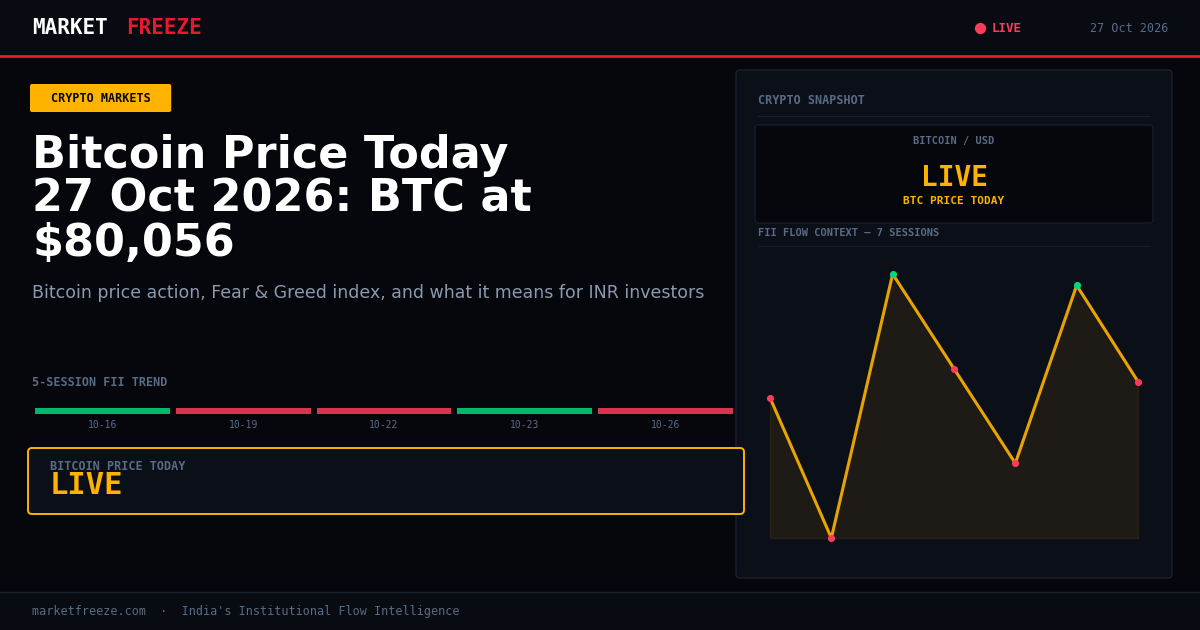
Bitcoin is trading at $80,069 USD, equivalent to ₹7,628,173 INR, marking a +0.32% change in the last 24 hours. Today’s market action is significantly influenced by the burgeoning narrative around Bitcoin miners pivoting into AI compute power. Luxor’s recent $16 million funding round, aimed at expanding its AI hardware and trading ventures, highlights this trend. This strategic move by miners suggests a diversification of revenue streams beyond traditional block rewards, potentially creating new avenues for hedging computing costs and prices. This development underscores a growing intersection between the traditional crypto mining infrastructure and the rapidly expanding artificial intelligence sector, drawing investor attention and capital as highlighted in live updates indicating AI buildouts attracting investment.
Open a free demat account with
Upstox
or
Angel One
— zero brokerage on delivery trades.
Bitcoin Mining’s New Frontier: AI Compute as a Hedge
The pivot of Bitcoin miners into the artificial intelligence compute market represents a significant evolution for the industry. Luxor’s successful $16 million funding round, backed by prominent players like CMT Digital, Canaan, and MicroBT, signals strong conviction in this new direction. The core idea is to leverage existing computational infrastructure and expertise to offer AI compute power as a service and a tradable commodity. For companies requiring substantial computing resources for AI model training and deployment, this offers a potential hedge against fluctuating hardware costs and prices. This move is not just about diversification; it’s about unlocking new revenue streams by tapping into the immense demand generated by the global AI buildout. As live updates indicate, this AI focus is drawing significant investor attention and capital, potentially influencing the broader digital asset landscape. The ability for miners to monetize their idle or underutilized processing power for AI tasks could lead to more stable earnings and a less cyclical business model, independent of Bitcoin’s price fluctuations. This strategic shift may also attract a different class of investors to the crypto mining sector, those more interested in the technological infrastructure and its application in emerging fields like AI, rather than solely in the price appreciation of cryptocurrencies.
The Ripple Effect: Does a Bank Win Translate to XRP Gains?
Despite a significant legal victory for Ripple, XRP has shown signs of weakness, failing to translate the positive development into substantial price gains. This disconnect between a fundamental legal win and market performance suggests that broader market dynamics or specific investor sentiment towards XRP may be overriding the impact of the court’s decision. While the news reported that Bitcoin shows signs of weakness while Ripple’s bank win fails to bolster XRP, the specific price action for XRP isn’t provided, making it difficult to quantify the extent of this underperformance. However, the narrative itself implies a lack of positive momentum. For Indian retail investors holding XRP, this divergence is a key point to monitor. It raises questions about the efficacy of legal resolutions as immediate price catalysts in the current crypto environment, especially when juxtaposed with the broader market narrative of AI buildouts attracting capital. The absence of significant upward movement in XRP, despite a positive legal outcome, could indicate that investor focus remains elsewhere, or that the market has already priced in such resolutions. This is a critical observation for those who may have anticipated a significant price surge following the bank win.
USD/INR Dynamics and Indian Crypto Investor Returns
Today, the USD/INR exchange rate stands at ₹95.27. For Indian investors holding cryptocurrencies denominated in USD, like Bitcoin and Ethereum, the current exchange rate plays a crucial role in determining their actual returns in INR. When the USD strengthens against the INR (meaning it takes more rupees to buy one dollar), the INR value of USD-denominated crypto holdings increases, even if the USD price of the crypto remains flat. Conversely, a weakening USD against the INR would decrease the INR value of these assets. Given Bitcoin’s price of $80,069 USD (₹7,628,173 INR) and Ethereum at $2,323 USD (₹221,312 INR), any appreciation or depreciation in the USD/INR rate directly impacts the INR-denominated value of these holdings. For instance, if the USD strengthens by 1% against the INR, the INR value of an investor’s Bitcoin holding would increase by 1% purely due to the currency movement, in addition to any price changes in Bitcoin itself. Today’s stable USD/INR rate of ₹95.27 means that currency fluctuations are not significantly boosting or detracting from crypto returns at this moment, allowing price action to be the primary driver of INR value changes. However, monitoring the USD/INR is a constant for Indian investors seeking to accurately gauge their portfolio performance.
Ethereum’s Performance Against Bitcoin: A Shifting Ratio
Ethereum is currently trading at $2,323 USD, or ₹221,312 INR, showing a +0.61% increase over the last 24 hours. The ETH/BTC ratio stands at 0.029, indicating that Bitcoin is outperforming Ethereum today. This ratio is a key metric for understanding relative strength within the crypto market. When the ETH/BTC ratio is rising, it suggests that Ether is gaining value faster than Bitcoin, and vice versa. Today’s ratio of 0.029, combined with Bitcoin’s +0.32% and Ethereum’s +0.61%, shows that while both are up, Bitcoin’s upward move is relatively stronger in percentage terms. This means that if an investor held a portfolio of both, the proportion allocated to Bitcoin would have increased relative to Ethereum. This underperformance of Ethereum relative to Bitcoin, despite both posting gains, warrants attention, especially if this trend persists. It could signal a preference for Bitcoin as a store of value or a narrative shift favoring BTC in the current market environment, potentially influenced by the AI buildout narrative drawing capital away from other altcoins and even Ethereum.
The Neutral Zone: Fear & Greed Index and Market Implications
The Crypto Fear & Greed Index currently stands at 48/100, placing it squarely in the “Neutral” zone. Historically, neutral readings, typically between 45 and 60, are not definitive signals of impending market direction. Instead, they often precede periods of increased volatility where the market can move significantly in either direction. This indecision suggests that the market is balanced, with neither extreme fear nor excessive greed dominating investor psychology. For Indian retail investors, a neutral reading implies that relying solely on the Fear & Greed Index as a contrarian indicator is less effective at this juncture. It underscores the importance of other analytical tools and data points, such as institutional flows and macroeconomic trends, to form a comprehensive view. The current neutral sentiment, coupled with the broader narrative of AI buildouts attracting capital, suggests a market cautiously weighing opportunities and risks without strong conviction. This environment can be challenging for short-term traders but may offer opportunities for longer-term investors who can identify assets with strong underlying fundamentals irrespective of short-term sentiment.
Institutional Flows: FII/DII Activity and Equity Market Links
Today’s FII (Foreign Institutional Investor) net flow in Indian equities is ₹0 Cr, indicating a pause in their net buying or selling activity. This is a notable shift compared to recent sessions where significant flows were observed. DII (Domestic Institutional Investor) net flow data is not provided for today’s session. The table below details FII and DII net flows for the last five trading sessions, providing crucial context for understanding institutional sentiment towards Indian equities.
| Date | FII Net (Cr) | DII Net (Cr) | Nifty Close |
|---|---|---|---|
| 2026-10-16 | +₹1,165.92 Cr | ₹-3,661.28 Cr | 22,888.95 |
| 2026-10-19 | ₹-1,148.64 Cr | +₹3,201.19 Cr | 22,888.95 |
| 2026-10-22 | ₹-3,458.70 Cr | +₹2,891.32 Cr | 22,600.00 |
| 2026-10-23 | +₹887.65 Cr | +₹3,235.36 Cr | 22,753.20 |
| 2026-10-26 | ₹-1,462.49 Cr | +₹2,609.57 Cr | 22,749.75 |
The current FII activity of ₹0 Cr, after a net selling of ₹1,462.49 Cr on the previous session, suggests a temporary halt in their aggressive selling or buying. This lack of decisive flow from FIIs can sometimes correlate with periods of consolidation or uncertainty in the equity markets. For Indian retail investors, understanding these institutional movements is vital, as large FII/DII flows can significantly influence market direction. The Nifty closed at 22749.75, and the absence of strong FII activity today means that domestic institutional buying and broader market sentiment will be the primary drivers of intraday movements. The historical data shows a mixed trend, with FIIs being net sellers on two occasions and net buyers on two occasions in the last five sessions, while DIIs have consistently been net buyers. This consistent DII support has likely provided a floor for the Nifty amidst FII outflows.
Navigating Crypto Tax: A Hypothetical INR 5 Lakh Bitcoin Sale
Let’s consider a hypothetical scenario for Indian crypto investors. Suppose an investor decides to sell Bitcoin worth ₹5,00,000 INR today. Bitcoin is trading at ₹7,628,173 INR per coin. This means the investor is selling approximately 0.06555 BTC (₹5,00,000 / ₹7,628,173). If this sale is considered a short-term capital gain (within 24 months of purchase), the profit will be taxed at 30% (plus applicable surcharge and cess). If it’s a long-term capital gain (held for over 24 months), the profit will be taxed at 20% (plus surcharge and cess) after indexation benefits. For example, if the investor bought this 0.06555 BTC for ₹3,00,000 INR exactly 18 months ago, the short-term capital gain would be ₹2,00,000 INR. The tax liability would be 30% of ₹2,00,000 INR, which amounts to ₹60,000 INR, plus any surcharge and cess. If the same purchase was made 30 months ago for ₹3,00,000 INR, and assuming indexation benefits reduce the taxable gain to, say, ₹1,50,000 INR, the long-term capital gain tax would be 20% of ₹1,50,000 INR, totaling ₹30,000 INR, plus surcharge and cess. It’s imperative for investors to maintain detailed records of all transactions to accurately calculate their tax liabilities. The current price of Bitcoin at $80,069 USD (₹7,628,173 INR) serves as the benchmark for calculating gains or losses on such sales.
Solana’s Performance and the Broader Altcoin Landscape
Solana is currently priced at $100.42 USD, or ₹9,567 INR, experiencing a -0.62% decrease in the last 24 hours. This performance indicates a slight bearish trend for Solana today, contrasting with the modest gains seen in Bitcoin and Ethereum. The broader altcoin market often follows Bitcoin’s lead, but individual assets can diverge based on specific news, ecosystem developments, or speculative interest. Solana’s current dip, while small, suggests it might be facing some selling pressure or is not benefiting from the same capital inflows as the larger cryptocurrencies today. The narrative around Bitcoin miners moving into AI compute could be drawing capital away from other sectors of the crypto market, potentially impacting altcoins like Solana. Investors in altcoins must closely watch not only Bitcoin’s price action but also the specific developments within their chosen altcoin’s ecosystem and the overall flow of capital across the digital asset space. The fact that Solana is trading down while BTC and ETH are up suggests a potential rotation out of mid-cap altcoins into the more established digital assets, or simply a temporary divergence in price discovery.
Key Levels to Watch for Nifty
With the Nifty closing at 22749.75 and FIIs showing a net flow of ₹0 Cr today, key levels to watch are influenced by the prevailing institutional buying and selling patterns. Given the recent net selling by FIIs on October 26th (₹-1,462.49 Cr), immediate support is likely to be around the 22,500 mark. However, sustained buying from DIIs (+₹2,609.57 Cr on October 26th) provides a strong cushion. If FIIs re-enter with significant buying pressure, resistance could emerge around the 23,000 level, a psychological and historical peak. Conversely, a renewed wave of FII selling, even with neutral today’s figures, could push Nifty towards the 22,300 level, which acted as support earlier in the month. The neutral Fear & Greed index at 48/100 suggests that a strong directional move might be initiated by significant catalysts, such as major policy changes or substantial shifts in FII/DII flows. For now, the 22,750 mark appears to be a pivot point, with trading sentiment likely to dictate a move towards either support or resistance.
Actionable Framework: Navigating Today’s Crypto Landscape
Here is a structured approach for Indian crypto investors based on today’s data:
- Monitor AI Narrative & Bitcoin Dominance: With Bitcoin miners pivoting to AI compute, a key theme is emerging. If this narrative continues to attract capital, expect Bitcoin to potentially outperform other cryptocurrencies, as seen in the ETH/BTC ratio of 0.029 today. Keep an eye on Luxor’s expansion and similar ventures.
- Assess USD/INR Impact on INR Returns: While today’s USD/INR rate of ₹95.27 is stable, any significant shift can materially impact your INR-denominated crypto gains or losses. Track this closely, especially if your primary goal is INR appreciation.
- Analyze FII/DII Flows for Equity Clues: Today’s ₹0 Cr FII net flow is a pause, but past selling pressure (₹-1,462.49 Cr on Oct 26th) cannot be ignored. Consistent DII buying (+₹2,609.57 Cr on Oct 26th) offers some stability. If FIIs return to selling, it may signal caution for Indian equities, potentially impacting overall investor risk appetite and indirectly influencing crypto.
- Observe Altcoin Divergence: Solana’s -0.62% move today, while BTC/ETH show modest gains, suggests potential altcoin weakness. If this trend persists, consider if capital is rotating towards dominant assets like Bitcoin due to the AI narrative or broader market uncertainty.
- Contextualize Fear & Greed: The neutral 48/100 index is not a strong directional signal. Use it in conjunction with other data. If the market starts to lean towards greed or fear, it might indicate a more pronounced upcoming move.
Frequently Asked Questions
Q: What did FII buy or sell on October 26, 2026?
A: FIIs were net sellers on October 26, 2026, with a net outflow of ₹-1,462.49 Cr.
Q: What did DII buy on October 26, 2026?
A: DIIs were net buyers on October 26, 2026, with a net inflow of +₹2,609.57 Cr.
Q: Is FII buying or selling in October 2026?
A: In October 2026, FIIs have shown mixed activity. They were net sellers on October 19th (₹-1,148.64 Cr) and October 22nd (₹-3,458.70 Cr), and also on October 26th (₹-1,462.49 Cr). However, they were net buyers on October 16th (+₹1,165.92 Cr) and October 23rd (+₹887.65 Cr). Today’s figure of ₹0 Cr indicates a pause in their significant buying or selling trend.
Bottom Line
Today’s crypto market is characterized by Bitcoin’s resilience around the $80,069 USD (₹7,628,173 INR) mark, buoyed by the significant narrative of miners entering the AI compute space. While Ethereum shows modest gains, Bitcoin is outperforming, as indicated by the 0.029 ETH/BTC ratio. The neutral Fear & Greed index at 48/100 suggests market indecision, reinforcing the need to look at broader institutional flows and macroeconomic factors. Indian equity markets are in a pause mode with FIIs at ₹0 Cr net today, but strong DII buying continues to provide support.
Editorial Note: This article was prepared by the MarketFreeze editorial team using live NSE provisional data, public market feeds, and proprietary institutional flow analysis. All price and flow figures are sourced directly from NSE, BSE, and CoinGecko as of 27 October 2026. This content is for informational purposes only and does not constitute investment advice. MarketFreeze is not SEBI-registered. Please consult a qualified financial advisor before making investment decisions. Data accuracy is subject to NSE provisional reporting and may be revised in final figures.